| Full name: G protein signaling modulator 2 | Alias Symbol: LGN|Pins | ||
| Type: protein-coding gene | Cytoband: 1p13.3 | ||
| Entrez ID: 29899 | HGNC ID: HGNC:29501 | Ensembl Gene: ENSG00000121957 | OMIM ID: 609245 |
Expression of GPSM2:
| Dataset | Gene | EntrezID | Probe | Log2FC | Adj.pValue | Expression |
|---|---|---|---|---|---|---|
| GSE17351 | GPSM2 | 29899 | 221922_at | -0.2583 | 0.6600 | |
| GSE20347 | GPSM2 | 29899 | 221922_at | -0.7580 | 0.0001 | |
| GSE23400 | GPSM2 | 29899 | 221922_at | -0.3466 | 0.0003 | |
| GSE26886 | GPSM2 | 29899 | 221922_at | -1.1563 | 0.0004 | |
| GSE29001 | GPSM2 | 29899 | 221922_at | -0.0739 | 0.8327 | |
| GSE38129 | GPSM2 | 29899 | 221922_at | -0.4383 | 0.0845 | |
| GSE45670 | GPSM2 | 29899 | 221922_at | -0.4768 | 0.0133 | |
| GSE53622 | GPSM2 | 29899 | 74424 | -0.5308 | 0.0000 | |
| GSE53624 | GPSM2 | 29899 | 74424 | -0.6130 | 0.0000 | |
| GSE63941 | GPSM2 | 29899 | 205240_at | 2.0337 | 0.0140 | |
| GSE77861 | GPSM2 | 29899 | 221922_at | -0.7740 | 0.0023 | |
| GSE97050 | GPSM2 | 29899 | A_23_P63402 | -0.3569 | 0.2045 | |
| SRP007169 | GPSM2 | 29899 | RNAseq | -0.8590 | 0.0951 | |
| SRP008496 | GPSM2 | 29899 | RNAseq | -1.2964 | 0.0016 | |
| SRP064894 | GPSM2 | 29899 | RNAseq | -0.5615 | 0.0494 | |
| SRP133303 | GPSM2 | 29899 | RNAseq | -0.4150 | 0.0895 | |
| SRP159526 | GPSM2 | 29899 | RNAseq | -1.2834 | 0.0000 | |
| SRP193095 | GPSM2 | 29899 | RNAseq | -0.6346 | 0.0006 | |
| SRP219564 | GPSM2 | 29899 | RNAseq | -0.6020 | 0.2636 | |
| TCGA | GPSM2 | 29899 | RNAseq | 0.2982 | 0.0002 |
Upregulated datasets: 1; Downregulated datasets: 3.
Survival by GPSM2 expression:
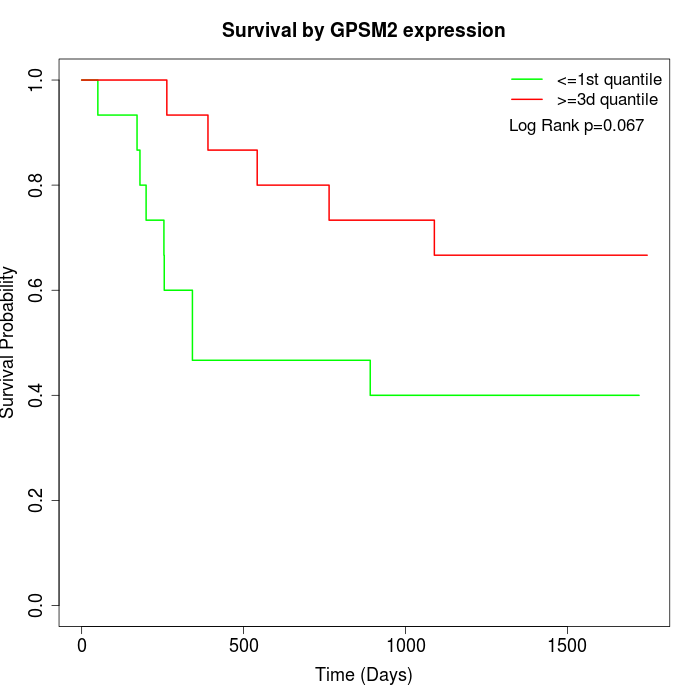 | 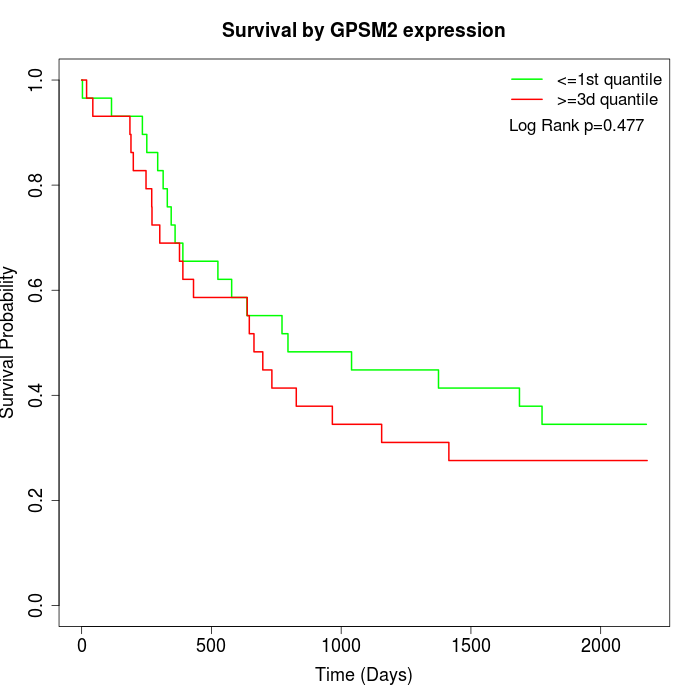 | 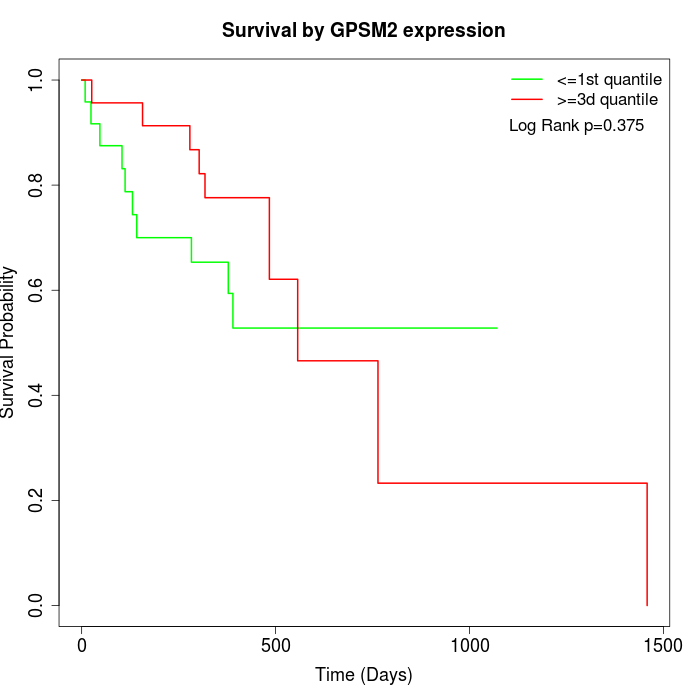 |
| GSE53622 | GSE53624 | TCGA |
Note: Click image to view full size file.
Copy number change of GPSM2:
| Dataset | Gene | EntrezID | Gain | Loss | Normal | Detail |
|---|---|---|---|---|---|---|
| GSE15526 | GPSM2 | 29899 | 0 | 12 | 18 | |
| GSE20123 | GPSM2 | 29899 | 0 | 11 | 19 | |
| GSE43470 | GPSM2 | 29899 | 0 | 8 | 35 | |
| GSE46452 | GPSM2 | 29899 | 2 | 1 | 56 | |
| GSE47630 | GPSM2 | 29899 | 9 | 5 | 26 | |
| GSE54993 | GPSM2 | 29899 | 0 | 1 | 69 | |
| GSE54994 | GPSM2 | 29899 | 7 | 4 | 42 | |
| GSE60625 | GPSM2 | 29899 | 0 | 0 | 11 | |
| GSE74703 | GPSM2 | 29899 | 0 | 6 | 30 | |
| GSE74704 | GPSM2 | 29899 | 0 | 7 | 13 | |
| TCGA | GPSM2 | 29899 | 8 | 26 | 62 |
Total number of gains: 26; Total number of losses: 81; Total Number of normals: 381.
Somatic mutations of GPSM2:
Generating mutation plots.
Highly correlated genes for GPSM2:
Showing top 20/825 corelated genes with mean PCC>0.5.
| Gene1 | Gene2 | Mean PCC | Num. Datasets | Num. PCC<0 | Num. PCC>0.5 |
|---|---|---|---|---|---|
| GPSM2 | AP3M1 | 0.74954 | 3 | 0 | 3 |
| GPSM2 | LPCAT2 | 0.722474 | 3 | 0 | 3 |
| GPSM2 | CRBN | 0.715423 | 3 | 0 | 3 |
| GPSM2 | UBE2V2 | 0.715011 | 3 | 0 | 3 |
| GPSM2 | WDR73 | 0.712603 | 3 | 0 | 3 |
| GPSM2 | PRPF38A | 0.698488 | 4 | 0 | 3 |
| GPSM2 | TMEM234 | 0.696609 | 3 | 0 | 3 |
| GPSM2 | NKIRAS1 | 0.695181 | 4 | 0 | 3 |
| GPSM2 | ALDH2 | 0.694795 | 5 | 0 | 5 |
| GPSM2 | PSMA5 | 0.694487 | 3 | 0 | 3 |
| GPSM2 | ZDHHC6 | 0.69251 | 3 | 0 | 3 |
| GPSM2 | TOP2B | 0.687383 | 3 | 0 | 3 |
| GPSM2 | PIGV | 0.686643 | 3 | 0 | 3 |
| GPSM2 | PHYHIPL | 0.68534 | 3 | 0 | 3 |
| GPSM2 | TWF2 | 0.684256 | 3 | 0 | 3 |
| GPSM2 | CLCC1 | 0.674234 | 8 | 0 | 6 |
| GPSM2 | RRAGC | 0.67124 | 4 | 0 | 3 |
| GPSM2 | ZNF436 | 0.67039 | 5 | 0 | 3 |
| GPSM2 | DNAJB6 | 0.667885 | 5 | 0 | 4 |
| GPSM2 | PITHD1 | 0.667464 | 6 | 0 | 5 |
For details and further investigation, click here