| Full name: cell death inducing DFFA like effector a | Alias Symbol: CIDE-A | ||
| Type: protein-coding gene | Cytoband: 18p11.21 | ||
| Entrez ID: 1149 | HGNC ID: HGNC:1976 | Ensembl Gene: ENSG00000176194 | OMIM ID: 604440 |
Expression of CIDEA:
| Dataset | Gene | EntrezID | Probe | Log2FC | Adj.pValue | Expression |
|---|---|---|---|---|---|---|
| GSE17351 | CIDEA | 1149 | 221295_at | -0.9620 | 0.3200 | |
| GSE20347 | CIDEA | 1149 | 221295_at | -0.7272 | 0.0004 | |
| GSE23400 | CIDEA | 1149 | 221295_at | -0.4986 | 0.0000 | |
| GSE26886 | CIDEA | 1149 | 221295_at | -0.1006 | 0.4179 | |
| GSE29001 | CIDEA | 1149 | 221295_at | -0.5868 | 0.0079 | |
| GSE38129 | CIDEA | 1149 | 221295_at | -1.0372 | 0.0001 | |
| GSE45670 | CIDEA | 1149 | 221295_at | -1.6059 | 0.0000 | |
| GSE53622 | CIDEA | 1149 | 73988 | -0.9878 | 0.0000 | |
| GSE53624 | CIDEA | 1149 | 73988 | -1.9161 | 0.0000 | |
| GSE63941 | CIDEA | 1149 | 221295_at | -0.0534 | 0.7206 | |
| GSE77861 | CIDEA | 1149 | 221295_at | -0.4421 | 0.0502 | |
| GSE97050 | CIDEA | 1149 | A_23_P376704 | -0.1241 | 0.6028 | |
| SRP064894 | CIDEA | 1149 | RNAseq | -3.3757 | 0.0000 | |
| SRP133303 | CIDEA | 1149 | RNAseq | -5.2974 | 0.0000 | |
| SRP159526 | CIDEA | 1149 | RNAseq | -3.7408 | 0.0000 | |
| TCGA | CIDEA | 1149 | RNAseq | -0.6926 | 0.3508 |
Upregulated datasets: 0; Downregulated datasets: 6.
Survival by CIDEA expression:
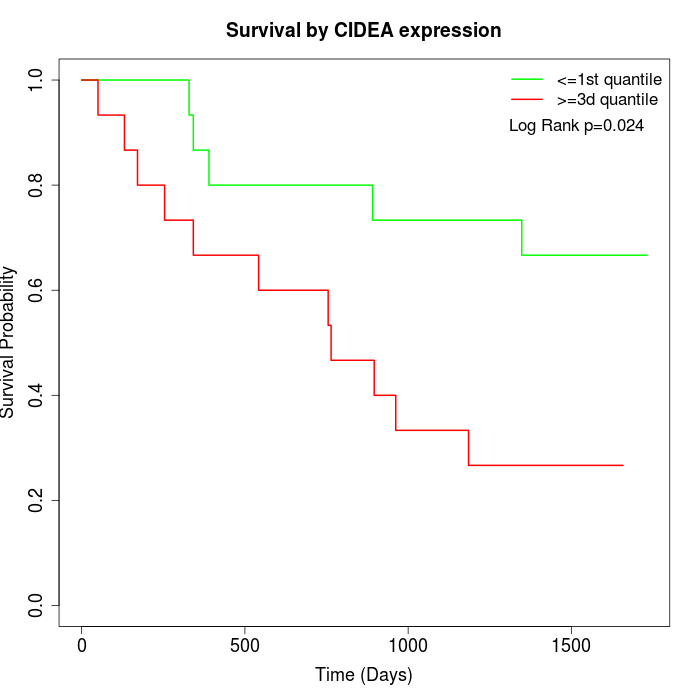 | 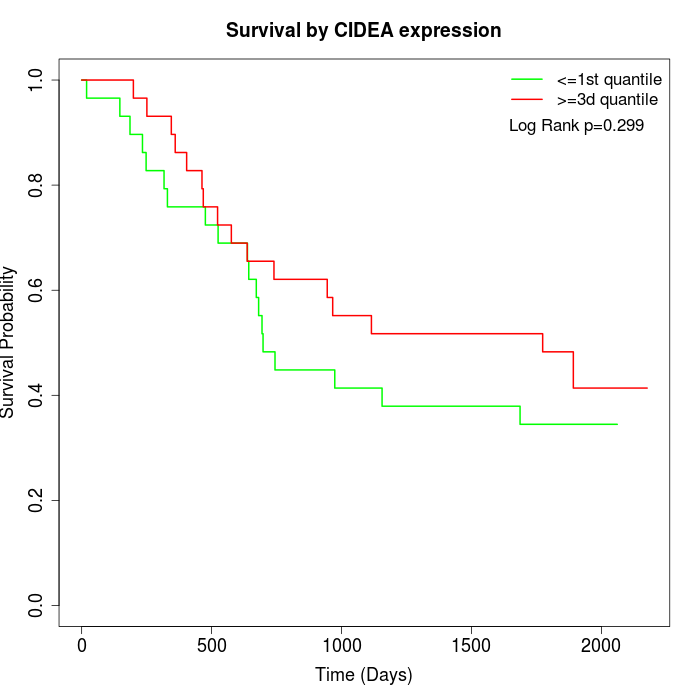 | 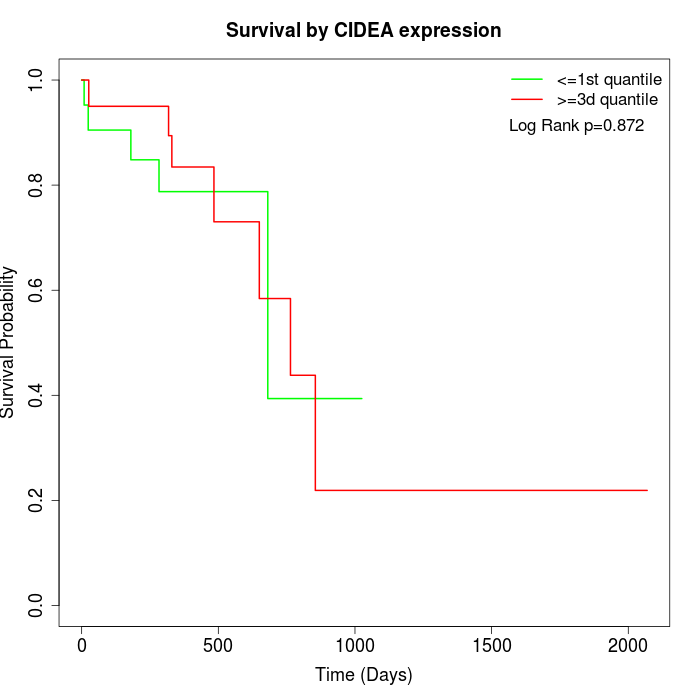 |
| GSE53622 | GSE53624 | TCGA |
Note: Click image to view full size file.
Copy number change of CIDEA:
| Dataset | Gene | EntrezID | Gain | Loss | Normal | Detail |
|---|---|---|---|---|---|---|
| GSE15526 | CIDEA | 1149 | 5 | 3 | 22 | |
| GSE20123 | CIDEA | 1149 | 5 | 3 | 22 | |
| GSE43470 | CIDEA | 1149 | 0 | 6 | 37 | |
| GSE46452 | CIDEA | 1149 | 3 | 21 | 35 | |
| GSE47630 | CIDEA | 1149 | 7 | 17 | 16 | |
| GSE54993 | CIDEA | 1149 | 6 | 2 | 62 | |
| GSE54994 | CIDEA | 1149 | 8 | 8 | 37 | |
| GSE60625 | CIDEA | 1149 | 0 | 4 | 7 | |
| GSE74703 | CIDEA | 1149 | 0 | 4 | 32 | |
| GSE74704 | CIDEA | 1149 | 3 | 2 | 15 | |
| TCGA | CIDEA | 1149 | 29 | 23 | 44 |
Total number of gains: 66; Total number of losses: 93; Total Number of normals: 329.
Somatic mutations of CIDEA:
Generating mutation plots.
Highly correlated genes for CIDEA:
Showing top 20/641 corelated genes with mean PCC>0.5.
| Gene1 | Gene2 | Mean PCC | Num. Datasets | Num. PCC<0 | Num. PCC>0.5 |
|---|---|---|---|---|---|
| CIDEA | FAM163B | 0.795515 | 3 | 0 | 3 |
| CIDEA | BARHL2 | 0.740076 | 3 | 0 | 3 |
| CIDEA | TEN1 | 0.731444 | 3 | 0 | 3 |
| CIDEA | HMGB4 | 0.723016 | 3 | 0 | 3 |
| CIDEA | TCP11L2 | 0.721865 | 4 | 0 | 4 |
| CIDEA | KRT74 | 0.721854 | 3 | 0 | 3 |
| CIDEA | MFSD2B | 0.714176 | 3 | 0 | 3 |
| CIDEA | PMM1 | 0.713745 | 10 | 0 | 10 |
| CIDEA | SFTA2 | 0.713029 | 3 | 0 | 3 |
| CIDEA | MUC22 | 0.707064 | 3 | 0 | 3 |
| CIDEA | OR2Z1 | 0.707012 | 3 | 0 | 3 |
| CIDEA | DNAH10 | 0.706453 | 3 | 0 | 3 |
| CIDEA | OR10G8 | 0.706377 | 3 | 0 | 3 |
| CIDEA | KRTAP20-1 | 0.703628 | 3 | 0 | 3 |
| CIDEA | ADAMTSL4 | 0.699707 | 8 | 0 | 8 |
| CIDEA | GPR62 | 0.696551 | 3 | 0 | 3 |
| CIDEA | GPR25 | 0.696361 | 6 | 0 | 5 |
| CIDEA | RETN | 0.696119 | 3 | 0 | 3 |
| CIDEA | KRTAP5-4 | 0.695987 | 3 | 0 | 3 |
| CIDEA | SUMF1 | 0.69493 | 3 | 0 | 3 |
For details and further investigation, click here