| Full name: Bardet-Biedl syndrome 9 | Alias Symbol: B1|PTHB1 | ||
| Type: protein-coding gene | Cytoband: 7p14.3 | ||
| Entrez ID: 27241 | HGNC ID: HGNC:30000 | Ensembl Gene: ENSG00000122507 | OMIM ID: 607968 |
Expression of BBS9:
| Dataset | Gene | EntrezID | Probe | Log2FC | Adj.pValue | Expression |
|---|---|---|---|---|---|---|
| GSE17351 | BBS9 | 27241 | 209958_s_at | -0.0914 | 0.8742 | |
| GSE20347 | BBS9 | 27241 | 37549_g_at | 0.0385 | 0.7071 | |
| GSE23400 | BBS9 | 27241 | 209958_s_at | 0.0732 | 0.0475 | |
| GSE26886 | BBS9 | 27241 | 37549_g_at | 0.6133 | 0.0006 | |
| GSE29001 | BBS9 | 27241 | 37549_g_at | 0.1221 | 0.5436 | |
| GSE38129 | BBS9 | 27241 | 209958_s_at | 0.1117 | 0.3403 | |
| GSE45670 | BBS9 | 27241 | 37549_g_at | -0.2705 | 0.0742 | |
| GSE53622 | BBS9 | 27241 | 164041 | -0.0827 | 0.4011 | |
| GSE53624 | BBS9 | 27241 | 51060 | 0.0260 | 0.7580 | |
| GSE63941 | BBS9 | 27241 | 209958_s_at | -0.6757 | 0.1508 | |
| GSE77861 | BBS9 | 27241 | 209958_s_at | -0.2144 | 0.2172 | |
| GSE97050 | BBS9 | 27241 | A_33_P3360087 | -0.2047 | 0.3379 | |
| SRP007169 | BBS9 | 27241 | RNAseq | -0.2991 | 0.5031 | |
| SRP008496 | BBS9 | 27241 | RNAseq | 0.3190 | 0.3858 | |
| SRP064894 | BBS9 | 27241 | RNAseq | 0.3379 | 0.0344 | |
| SRP133303 | BBS9 | 27241 | RNAseq | -0.2235 | 0.1744 | |
| SRP159526 | BBS9 | 27241 | RNAseq | 0.0787 | 0.7814 | |
| SRP193095 | BBS9 | 27241 | RNAseq | -0.0865 | 0.5394 | |
| SRP219564 | BBS9 | 27241 | RNAseq | -0.1934 | 0.6997 | |
| TCGA | BBS9 | 27241 | RNAseq | -0.0475 | 0.5194 |
Upregulated datasets: 0; Downregulated datasets: 0.
Survival by BBS9 expression:
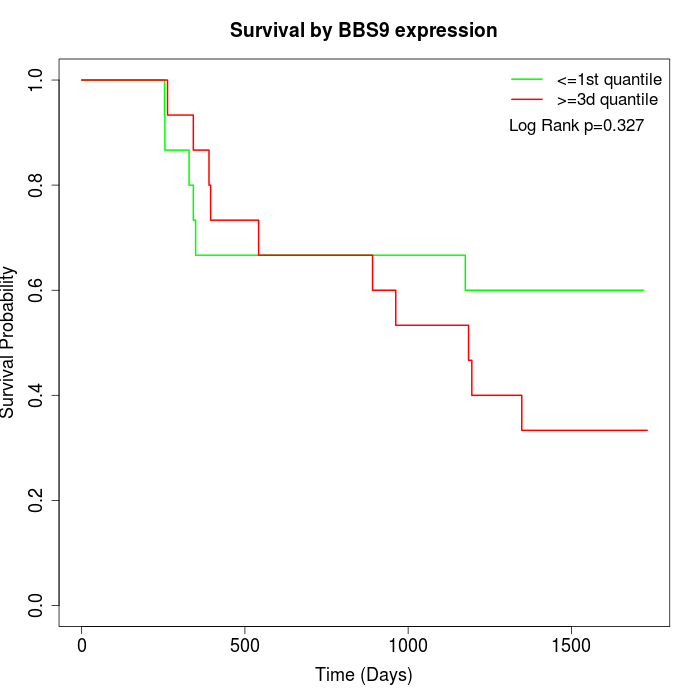 | 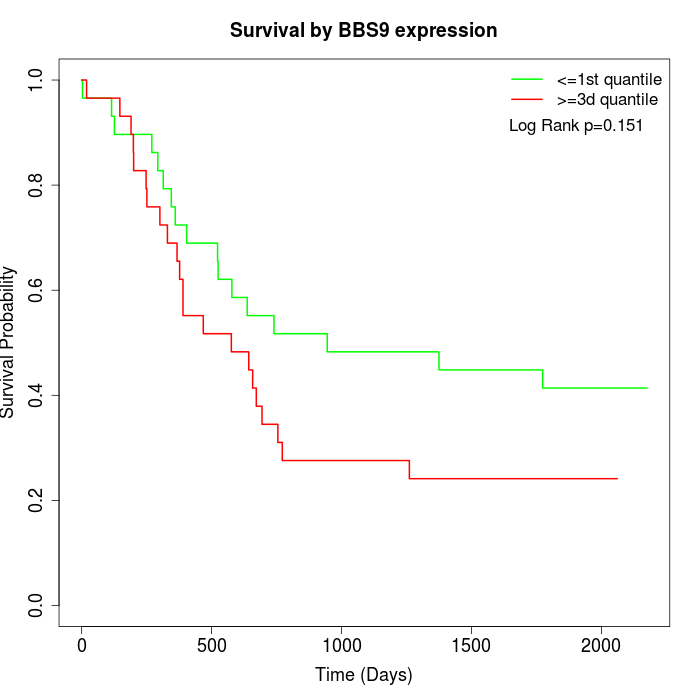 | 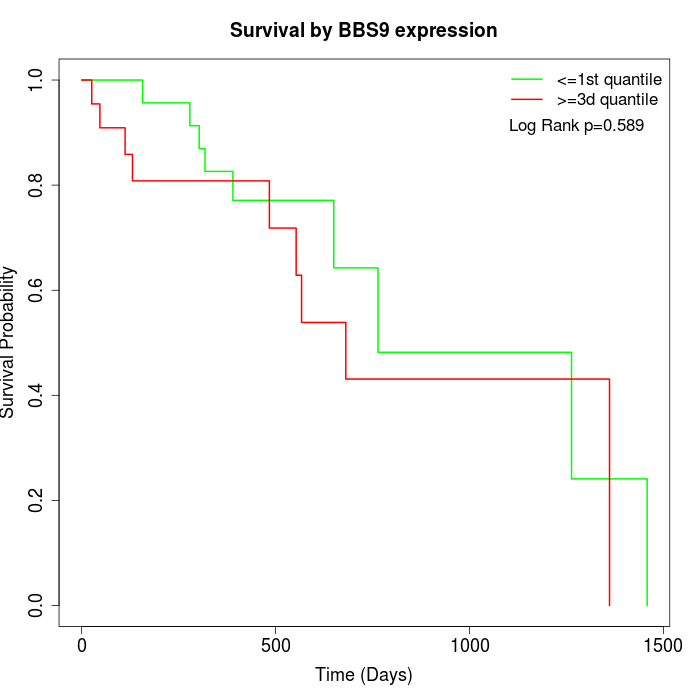 |
| GSE53622 | GSE53624 | TCGA |
Note: Click image to view full size file.
Copy number change of BBS9:
| Dataset | Gene | EntrezID | Gain | Loss | Normal | Detail |
|---|---|---|---|---|---|---|
| GSE15526 | BBS9 | 27241 | 16 | 0 | 14 | |
| GSE20123 | BBS9 | 27241 | 16 | 0 | 14 | |
| GSE43470 | BBS9 | 27241 | 4 | 1 | 38 | |
| GSE46452 | BBS9 | 27241 | 11 | 1 | 47 | |
| GSE47630 | BBS9 | 27241 | 8 | 1 | 31 | |
| GSE54993 | BBS9 | 27241 | 0 | 7 | 63 | |
| GSE54994 | BBS9 | 27241 | 20 | 2 | 31 | |
| GSE60625 | BBS9 | 27241 | 0 | 0 | 11 | |
| GSE74703 | BBS9 | 27241 | 4 | 1 | 31 | |
| GSE74704 | BBS9 | 27241 | 10 | 0 | 10 | |
| TCGA | BBS9 | 27241 | 55 | 8 | 33 |
Total number of gains: 144; Total number of losses: 21; Total Number of normals: 323.
Somatic mutations of BBS9:
Generating mutation plots.
Highly correlated genes for BBS9:
Showing top 20/270 corelated genes with mean PCC>0.5.
| Gene1 | Gene2 | Mean PCC | Num. Datasets | Num. PCC<0 | Num. PCC>0.5 |
|---|---|---|---|---|---|
| BBS9 | DEXI | 0.79482 | 3 | 0 | 3 |
| BBS9 | NEK7 | 0.789515 | 3 | 0 | 3 |
| BBS9 | C12orf65 | 0.78684 | 3 | 0 | 3 |
| BBS9 | HADHB | 0.782956 | 3 | 0 | 3 |
| BBS9 | OSBPL9 | 0.77972 | 3 | 0 | 3 |
| BBS9 | KLF7 | 0.77934 | 3 | 0 | 3 |
| BBS9 | BOD1 | 0.769921 | 3 | 0 | 3 |
| BBS9 | HAGH | 0.769181 | 3 | 0 | 3 |
| BBS9 | MEF2D | 0.750948 | 3 | 0 | 3 |
| BBS9 | ANKRD10 | 0.743714 | 3 | 0 | 3 |
| BBS9 | HSPA2 | 0.741941 | 3 | 0 | 3 |
| BBS9 | ZNF319 | 0.734679 | 3 | 0 | 3 |
| BBS9 | ZNF322 | 0.733995 | 3 | 0 | 3 |
| BBS9 | BSN | 0.732626 | 3 | 0 | 3 |
| BBS9 | AGL | 0.727905 | 4 | 0 | 3 |
| BBS9 | SNX15 | 0.723886 | 3 | 0 | 3 |
| BBS9 | ZFP90 | 0.72199 | 3 | 0 | 3 |
| BBS9 | ACO1 | 0.721822 | 3 | 0 | 3 |
| BBS9 | HGSNAT | 0.720652 | 3 | 0 | 3 |
| BBS9 | UXT | 0.717647 | 3 | 0 | 3 |
For details and further investigation, click here