| Full name: myocyte enhancer factor 2D | Alias Symbol: | ||
| Type: protein-coding gene | Cytoband: 1q22 | ||
| Entrez ID: 4209 | HGNC ID: HGNC:6997 | Ensembl Gene: ENSG00000116604 | OMIM ID: 600663 |
Screen Evidence:
| |||
MEF2D involved pathways:
| KEGG pathway | Description | View |
|---|---|---|
| hsa04022 | cGMP-PKG signaling pathway |
Expression of MEF2D:
| Dataset | Gene | EntrezID | Probe | Log2FC | Adj.pValue | Expression |
|---|---|---|---|---|---|---|
| GSE17351 | MEF2D | 4209 | 225641_at | -0.3079 | 0.4865 | |
| GSE20347 | MEF2D | 4209 | 203004_s_at | -0.1306 | 0.1353 | |
| GSE23400 | MEF2D | 4209 | 203004_s_at | -0.1865 | 0.0000 | |
| GSE26886 | MEF2D | 4209 | 225641_at | 0.7899 | 0.0011 | |
| GSE29001 | MEF2D | 4209 | 203003_at | -0.1227 | 0.5356 | |
| GSE38129 | MEF2D | 4209 | 203004_s_at | -0.1346 | 0.1251 | |
| GSE45670 | MEF2D | 4209 | 225641_at | -0.5312 | 0.0000 | |
| GSE53622 | MEF2D | 4209 | 151807 | -0.9115 | 0.0000 | |
| GSE53624 | MEF2D | 4209 | 61713 | -0.4585 | 0.0000 | |
| GSE63941 | MEF2D | 4209 | 225641_at | -0.5786 | 0.0830 | |
| GSE77861 | MEF2D | 4209 | 225641_at | 0.0557 | 0.5643 | |
| GSE97050 | MEF2D | 4209 | A_33_P3341656 | -0.9107 | 0.0903 | |
| SRP007169 | MEF2D | 4209 | RNAseq | -0.9739 | 0.0083 | |
| SRP008496 | MEF2D | 4209 | RNAseq | -0.5226 | 0.0187 | |
| SRP064894 | MEF2D | 4209 | RNAseq | -0.3463 | 0.0359 | |
| SRP133303 | MEF2D | 4209 | RNAseq | -0.2553 | 0.0956 | |
| SRP159526 | MEF2D | 4209 | RNAseq | -0.2976 | 0.1720 | |
| SRP193095 | MEF2D | 4209 | RNAseq | 0.1359 | 0.3794 | |
| SRP219564 | MEF2D | 4209 | RNAseq | -0.1212 | 0.7842 | |
| TCGA | MEF2D | 4209 | RNAseq | -0.2250 | 0.0000 |
Upregulated datasets: 0; Downregulated datasets: 0.
Survival by MEF2D expression:
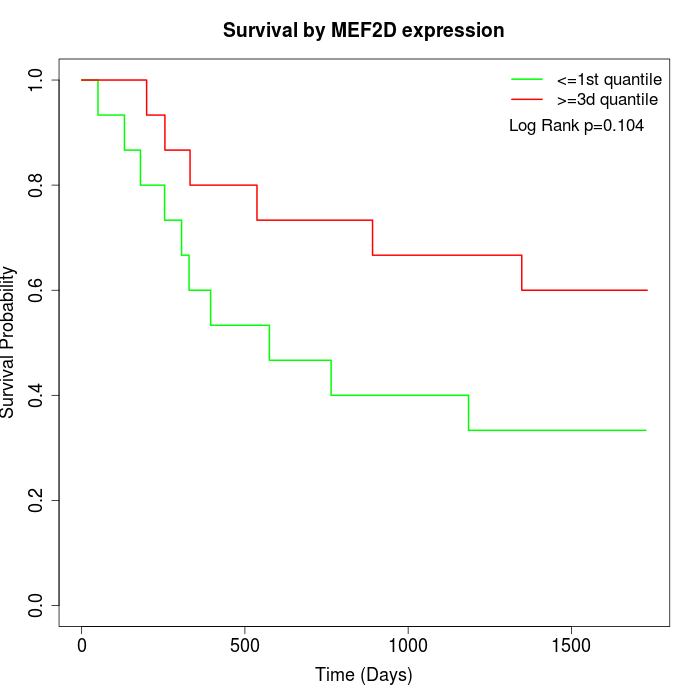 | 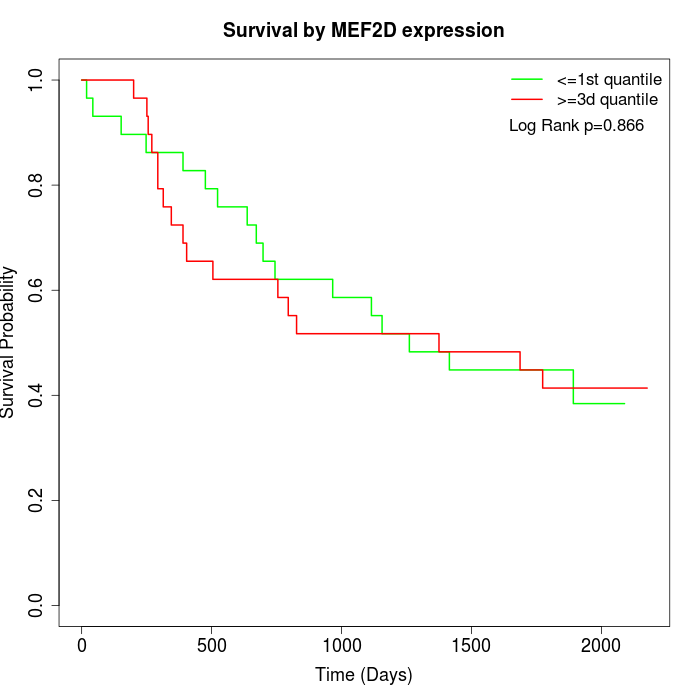 | 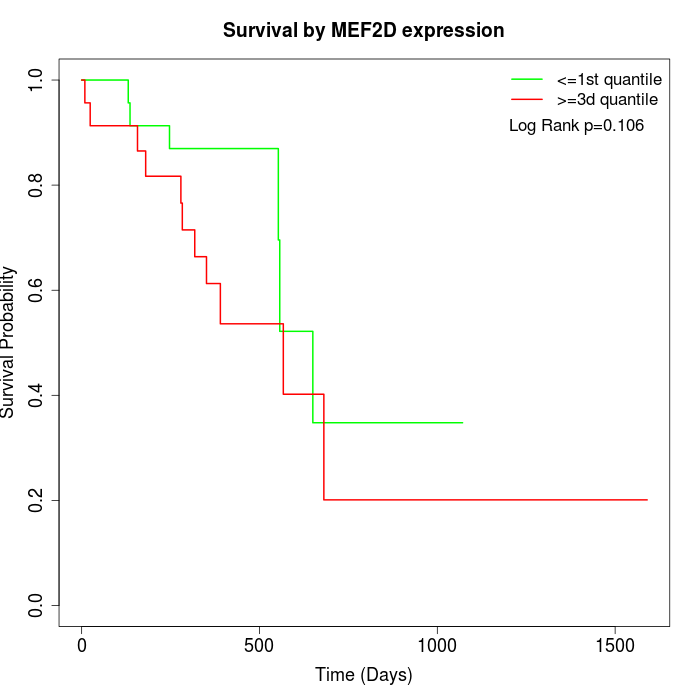 |
| GSE53622 | GSE53624 | TCGA |
Note: Click image to view full size file.
Copy number change of MEF2D:
| Dataset | Gene | EntrezID | Gain | Loss | Normal | Detail |
|---|---|---|---|---|---|---|
| GSE15526 | MEF2D | 4209 | 12 | 0 | 18 | |
| GSE20123 | MEF2D | 4209 | 12 | 0 | 18 | |
| GSE43470 | MEF2D | 4209 | 7 | 2 | 34 | |
| GSE46452 | MEF2D | 4209 | 2 | 1 | 56 | |
| GSE47630 | MEF2D | 4209 | 14 | 0 | 26 | |
| GSE54993 | MEF2D | 4209 | 0 | 5 | 65 | |
| GSE54994 | MEF2D | 4209 | 16 | 0 | 37 | |
| GSE60625 | MEF2D | 4209 | 0 | 0 | 11 | |
| GSE74703 | MEF2D | 4209 | 7 | 2 | 27 | |
| GSE74704 | MEF2D | 4209 | 6 | 0 | 14 | |
| TCGA | MEF2D | 4209 | 38 | 2 | 56 |
Total number of gains: 114; Total number of losses: 12; Total Number of normals: 362.
Somatic mutations of MEF2D:
Generating mutation plots.
Highly correlated genes for MEF2D:
Showing top 20/536 corelated genes with mean PCC>0.5.
| Gene1 | Gene2 | Mean PCC | Num. Datasets | Num. PCC<0 | Num. PCC>0.5 |
|---|---|---|---|---|---|
| MEF2D | UBXN10 | 0.873211 | 3 | 0 | 3 |
| MEF2D | JMY | 0.797731 | 3 | 0 | 3 |
| MEF2D | TCEAL5 | 0.795095 | 3 | 0 | 3 |
| MEF2D | SLMAP | 0.790549 | 5 | 0 | 5 |
| MEF2D | TNFSF12 | 0.789445 | 3 | 0 | 3 |
| MEF2D | SPOPL | 0.78035 | 3 | 0 | 3 |
| MEF2D | ANAPC16 | 0.77514 | 3 | 0 | 3 |
| MEF2D | FHL3 | 0.775084 | 3 | 0 | 3 |
| MEF2D | TMEM132C | 0.769027 | 3 | 0 | 3 |
| MEF2D | C1QTNF7 | 0.762885 | 5 | 0 | 5 |
| MEF2D | CLEC3B | 0.75665 | 3 | 0 | 3 |
| MEF2D | RNF150 | 0.755043 | 5 | 0 | 5 |
| MEF2D | BBS9 | 0.750948 | 3 | 0 | 3 |
| MEF2D | PDK3 | 0.748801 | 4 | 0 | 4 |
| MEF2D | RRNAD1 | 0.743862 | 3 | 0 | 3 |
| MEF2D | C5orf24 | 0.743194 | 3 | 0 | 3 |
| MEF2D | SNX15 | 0.742951 | 3 | 0 | 3 |
| MEF2D | CFL2 | 0.73319 | 5 | 0 | 5 |
| MEF2D | RASSF3 | 0.733055 | 6 | 0 | 6 |
| MEF2D | LRCH2 | 0.732866 | 4 | 0 | 4 |
For details and further investigation, click here