| Full name: BCL2 like 13 | Alias Symbol: MIL1|BCL-RAMBO | ||
| Type: protein-coding gene | Cytoband: 22q11.21 | ||
| Entrez ID: 23786 | HGNC ID: HGNC:17164 | Ensembl Gene: ENSG00000099968 | OMIM ID: |
Expression of BCL2L13:
| Dataset | Gene | EntrezID | Probe | Log2FC | Adj.pValue | Expression |
|---|---|---|---|---|---|---|
| GSE17351 | BCL2L13 | 23786 | 217955_at | -0.3343 | 0.4570 | |
| GSE20347 | BCL2L13 | 23786 | 217955_at | -0.2587 | 0.1750 | |
| GSE23400 | BCL2L13 | 23786 | 217955_at | 0.2662 | 0.0007 | |
| GSE26886 | BCL2L13 | 23786 | 217955_at | -0.0151 | 0.9624 | |
| GSE29001 | BCL2L13 | 23786 | 217955_at | -0.1419 | 0.7098 | |
| GSE38129 | BCL2L13 | 23786 | 217955_at | -0.1786 | 0.3226 | |
| GSE45670 | BCL2L13 | 23786 | 217955_at | 0.1304 | 0.5391 | |
| GSE53622 | BCL2L13 | 23786 | 111849 | 0.1904 | 0.0017 | |
| GSE53624 | BCL2L13 | 23786 | 111849 | 0.1555 | 0.0025 | |
| GSE63941 | BCL2L13 | 23786 | 217955_at | -0.4638 | 0.3736 | |
| GSE77861 | BCL2L13 | 23786 | 217955_at | 0.3337 | 0.1360 | |
| GSE97050 | BCL2L13 | 23786 | A_23_P102965 | -0.2687 | 0.3048 | |
| SRP007169 | BCL2L13 | 23786 | RNAseq | 0.2535 | 0.4941 | |
| SRP008496 | BCL2L13 | 23786 | RNAseq | 0.2791 | 0.3837 | |
| SRP064894 | BCL2L13 | 23786 | RNAseq | 0.1071 | 0.3931 | |
| SRP133303 | BCL2L13 | 23786 | RNAseq | -0.0160 | 0.8904 | |
| SRP159526 | BCL2L13 | 23786 | RNAseq | 0.0536 | 0.8769 | |
| SRP193095 | BCL2L13 | 23786 | RNAseq | 0.0487 | 0.6855 | |
| SRP219564 | BCL2L13 | 23786 | RNAseq | -0.0087 | 0.9836 | |
| TCGA | BCL2L13 | 23786 | RNAseq | -0.0154 | 0.7426 |
Upregulated datasets: 0; Downregulated datasets: 0.
Survival by BCL2L13 expression:
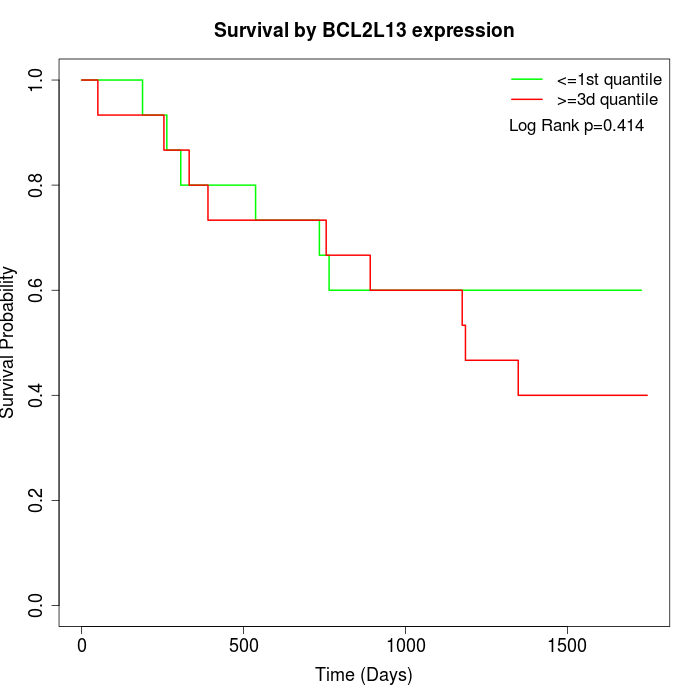 | 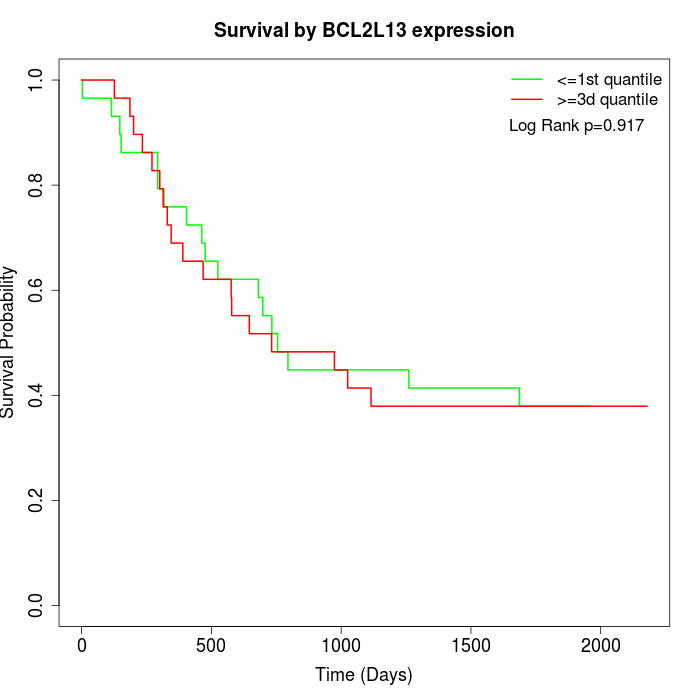 | 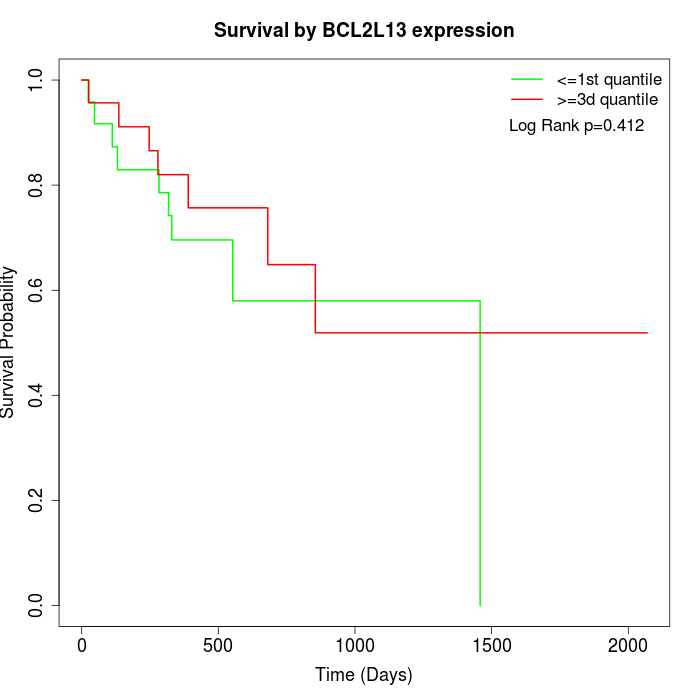 |
| GSE53622 | GSE53624 | TCGA |
Note: Click image to view full size file.
Copy number change of BCL2L13:
| Dataset | Gene | EntrezID | Gain | Loss | Normal | Detail |
|---|---|---|---|---|---|---|
| GSE15526 | BCL2L13 | 23786 | 4 | 7 | 19 | |
| GSE20123 | BCL2L13 | 23786 | 4 | 7 | 19 | |
| GSE43470 | BCL2L13 | 23786 | 5 | 7 | 31 | |
| GSE46452 | BCL2L13 | 23786 | 32 | 2 | 25 | |
| GSE47630 | BCL2L13 | 23786 | 8 | 5 | 27 | |
| GSE54993 | BCL2L13 | 23786 | 3 | 7 | 60 | |
| GSE54994 | BCL2L13 | 23786 | 12 | 7 | 34 | |
| GSE60625 | BCL2L13 | 23786 | 5 | 0 | 6 | |
| GSE74703 | BCL2L13 | 23786 | 5 | 5 | 26 | |
| GSE74704 | BCL2L13 | 23786 | 2 | 4 | 14 | |
| TCGA | BCL2L13 | 23786 | 25 | 17 | 54 |
Total number of gains: 105; Total number of losses: 68; Total Number of normals: 315.
Somatic mutations of BCL2L13:
Generating mutation plots.
Highly correlated genes for BCL2L13:
Showing top 20/21 corelated genes with mean PCC>0.5.
| Gene1 | Gene2 | Mean PCC | Num. Datasets | Num. PCC<0 | Num. PCC>0.5 |
|---|---|---|---|---|---|
| BCL2L13 | GPC3 | 0.761698 | 3 | 0 | 3 |
| BCL2L13 | GNAZ | 0.745582 | 3 | 0 | 3 |
| BCL2L13 | KRTAP19-1 | 0.703345 | 3 | 0 | 3 |
| BCL2L13 | KLHL42 | 0.685382 | 3 | 0 | 3 |
| BCL2L13 | VAMP4 | 0.685072 | 4 | 0 | 3 |
| BCL2L13 | KIAA1671 | 0.674881 | 3 | 0 | 3 |
| BCL2L13 | NUBP1 | 0.66797 | 3 | 0 | 3 |
| BCL2L13 | TFE3 | 0.599537 | 5 | 0 | 3 |
| BCL2L13 | HEBP1 | 0.588573 | 6 | 0 | 4 |
| BCL2L13 | ENOX2 | 0.587203 | 3 | 0 | 3 |
| BCL2L13 | ALKBH5 | 0.581395 | 5 | 0 | 3 |
| BCL2L13 | PEX7 | 0.579481 | 3 | 0 | 3 |
| BCL2L13 | HDAC4 | 0.56943 | 6 | 0 | 3 |
| BCL2L13 | SVIL | 0.564936 | 5 | 0 | 3 |
| BCL2L13 | PAFAH1B1 | 0.563952 | 5 | 0 | 3 |
| BCL2L13 | VWA8 | 0.552753 | 4 | 0 | 4 |
| BCL2L13 | EDC3 | 0.550279 | 4 | 0 | 3 |
| BCL2L13 | ETFB | 0.535614 | 5 | 0 | 4 |
| BCL2L13 | CUTC | 0.525225 | 8 | 0 | 4 |
| BCL2L13 | CD81 | 0.520913 | 4 | 0 | 3 |
For details and further investigation, click here