| Full name: heme binding protein 1 | Alias Symbol: HEBP|HBP | ||
| Type: protein-coding gene | Cytoband: 12p13.1 | ||
| Entrez ID: 50865 | HGNC ID: HGNC:17176 | Ensembl Gene: ENSG00000013583 | OMIM ID: 605826 |
| Related drugs: BARDOXOLONE METHYL... [more] | |||
Expression of HEBP1:
| Dataset | Gene | EntrezID | Probe | Log2FC | Adj.pValue | Expression |
|---|---|---|---|---|---|---|
| GSE17351 | HEBP1 | 50865 | 218450_at | -0.1964 | 0.6535 | |
| GSE20347 | HEBP1 | 50865 | 218450_at | -0.2464 | 0.1992 | |
| GSE23400 | HEBP1 | 50865 | 218450_at | -0.0086 | 0.9272 | |
| GSE26886 | HEBP1 | 50865 | 218450_at | 0.0281 | 0.9456 | |
| GSE29001 | HEBP1 | 50865 | 218450_at | -0.1825 | 0.6731 | |
| GSE38129 | HEBP1 | 50865 | 218450_at | -0.2954 | 0.0579 | |
| GSE45670 | HEBP1 | 50865 | 218450_at | -0.4035 | 0.0228 | |
| GSE53622 | HEBP1 | 50865 | 28409 | -0.1338 | 0.0401 | |
| GSE53624 | HEBP1 | 50865 | 28409 | 0.0192 | 0.7005 | |
| GSE63941 | HEBP1 | 50865 | 218450_at | -1.9424 | 0.0009 | |
| GSE77861 | HEBP1 | 50865 | 218450_at | 0.1578 | 0.6844 | |
| GSE97050 | HEBP1 | 50865 | A_23_P117082 | -0.2752 | 0.3193 | |
| SRP007169 | HEBP1 | 50865 | RNAseq | -0.9361 | 0.0222 | |
| SRP008496 | HEBP1 | 50865 | RNAseq | -0.4319 | 0.1018 | |
| SRP064894 | HEBP1 | 50865 | RNAseq | -0.2638 | 0.2763 | |
| SRP133303 | HEBP1 | 50865 | RNAseq | 0.0489 | 0.8066 | |
| SRP159526 | HEBP1 | 50865 | RNAseq | -0.2369 | 0.2614 | |
| SRP193095 | HEBP1 | 50865 | RNAseq | -0.5050 | 0.0149 | |
| SRP219564 | HEBP1 | 50865 | RNAseq | -0.1633 | 0.6738 | |
| TCGA | HEBP1 | 50865 | RNAseq | 0.0266 | 0.6337 |
Upregulated datasets: 0; Downregulated datasets: 1.
Survival by HEBP1 expression:
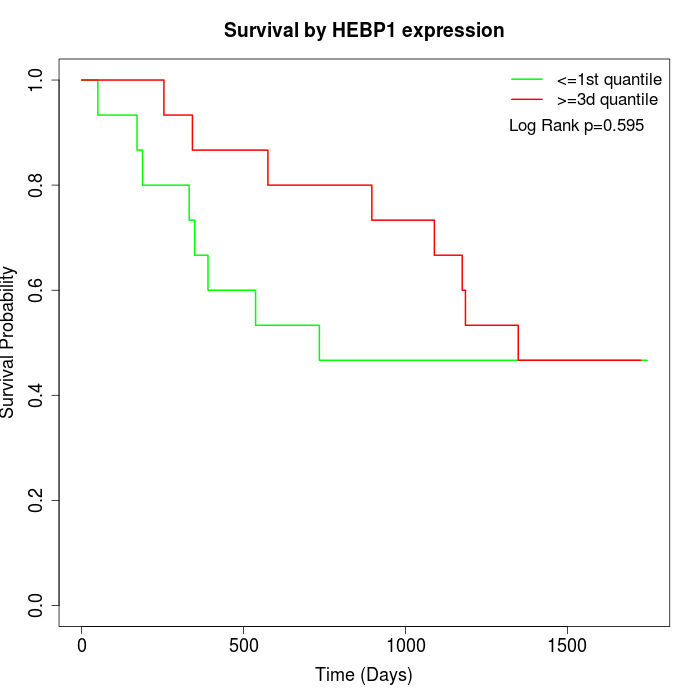 | 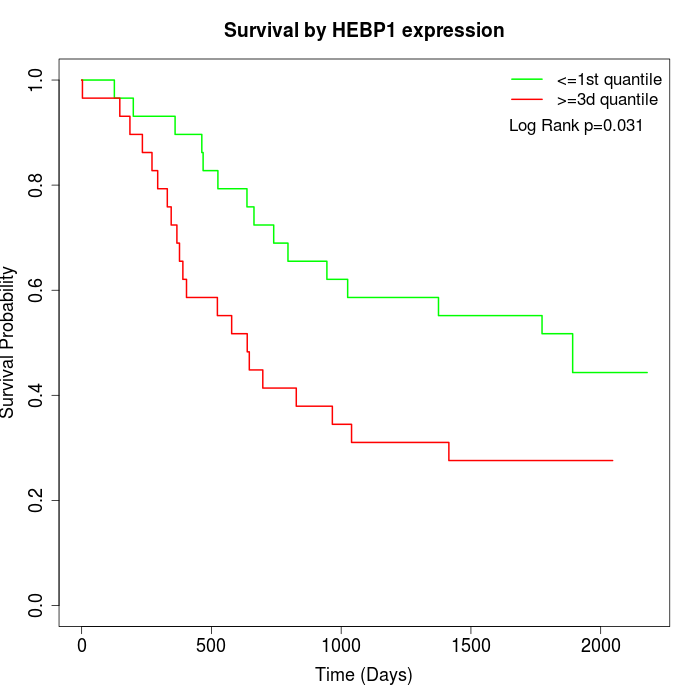 | 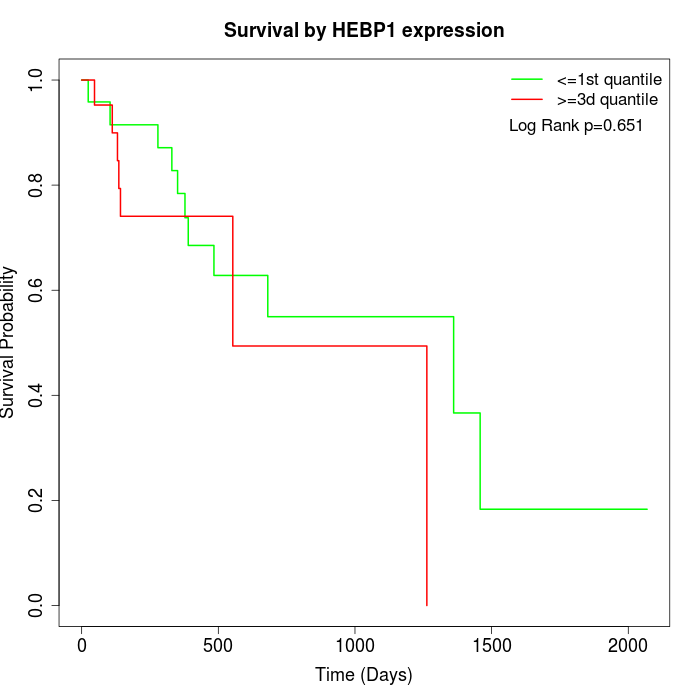 |
| GSE53622 | GSE53624 | TCGA |
Note: Click image to view full size file.
Copy number change of HEBP1:
| Dataset | Gene | EntrezID | Gain | Loss | Normal | Detail |
|---|---|---|---|---|---|---|
| GSE15526 | HEBP1 | 50865 | 6 | 2 | 22 | |
| GSE20123 | HEBP1 | 50865 | 6 | 2 | 22 | |
| GSE43470 | HEBP1 | 50865 | 9 | 4 | 30 | |
| GSE46452 | HEBP1 | 50865 | 10 | 1 | 48 | |
| GSE47630 | HEBP1 | 50865 | 13 | 2 | 25 | |
| GSE54993 | HEBP1 | 50865 | 2 | 9 | 59 | |
| GSE54994 | HEBP1 | 50865 | 10 | 2 | 41 | |
| GSE60625 | HEBP1 | 50865 | 0 | 1 | 10 | |
| GSE74703 | HEBP1 | 50865 | 9 | 3 | 24 | |
| GSE74704 | HEBP1 | 50865 | 4 | 1 | 15 | |
| TCGA | HEBP1 | 50865 | 39 | 7 | 50 |
Total number of gains: 108; Total number of losses: 34; Total Number of normals: 346.
Somatic mutations of HEBP1:
Generating mutation plots.
Highly correlated genes for HEBP1:
Showing top 20/75 corelated genes with mean PCC>0.5.
| Gene1 | Gene2 | Mean PCC | Num. Datasets | Num. PCC<0 | Num. PCC>0.5 |
|---|---|---|---|---|---|
| HEBP1 | ZCCHC18 | 0.735526 | 3 | 0 | 3 |
| HEBP1 | TBX2 | 0.709468 | 3 | 0 | 3 |
| HEBP1 | KATNAL2 | 0.69951 | 3 | 0 | 3 |
| HEBP1 | LINC01279 | 0.697405 | 3 | 0 | 3 |
| HEBP1 | COX8A | 0.687993 | 3 | 0 | 3 |
| HEBP1 | NICN1 | 0.686063 | 3 | 0 | 3 |
| HEBP1 | USP51 | 0.678457 | 3 | 0 | 3 |
| HEBP1 | BAALC | 0.676103 | 3 | 0 | 3 |
| HEBP1 | LDB2 | 0.676052 | 5 | 0 | 5 |
| HEBP1 | SLC35G1 | 0.668315 | 3 | 0 | 3 |
| HEBP1 | PKDCC | 0.666747 | 5 | 0 | 4 |
| HEBP1 | DDIT4L | 0.663057 | 4 | 0 | 3 |
| HEBP1 | WDR44 | 0.661569 | 4 | 0 | 4 |
| HEBP1 | MAMLD1 | 0.652693 | 4 | 0 | 3 |
| HEBP1 | C16orf89 | 0.64869 | 4 | 0 | 3 |
| HEBP1 | FAT4 | 0.64796 | 5 | 0 | 5 |
| HEBP1 | HRCT1 | 0.643162 | 3 | 0 | 3 |
| HEBP1 | FGD5 | 0.638433 | 3 | 0 | 3 |
| HEBP1 | FAM171A1 | 0.635612 | 6 | 0 | 5 |
| HEBP1 | SEC13 | 0.634735 | 4 | 0 | 3 |
For details and further investigation, click here