| Full name: chromosome 2 open reading frame 15 | Alias Symbol: MGC29762 | ||
| Type: protein-coding gene | Cytoband: 2q11.2 | ||
| Entrez ID: 150590 | HGNC ID: HGNC:28436 | Ensembl Gene: ENSG00000273045 | OMIM ID: |
Expression of C2orf15:
| Dataset | Gene | EntrezID | Probe | Log2FC | Adj.pValue | Expression |
|---|---|---|---|---|---|---|
| GSE17351 | C2orf15 | 150590 | 1552740_at | -0.0167 | 0.9677 | |
| GSE26886 | C2orf15 | 150590 | 1552740_at | 0.1406 | 0.4386 | |
| GSE45670 | C2orf15 | 150590 | 1552740_at | 0.0214 | 0.9065 | |
| GSE53622 | C2orf15 | 150590 | 31251 | -0.5694 | 0.0035 | |
| GSE53624 | C2orf15 | 150590 | 31251 | -0.7164 | 0.0000 | |
| GSE63941 | C2orf15 | 150590 | 1552740_at | 0.5600 | 0.0797 | |
| GSE77861 | C2orf15 | 150590 | 1552740_at | -0.0008 | 0.9947 | |
| SRP007169 | C2orf15 | 150590 | RNAseq | -0.6320 | 0.3272 | |
| SRP133303 | C2orf15 | 150590 | RNAseq | -0.0914 | 0.7999 | |
| SRP159526 | C2orf15 | 150590 | RNAseq | 0.3025 | 0.4686 | |
| SRP193095 | C2orf15 | 150590 | RNAseq | -0.6500 | 0.0004 | |
| TCGA | C2orf15 | 150590 | RNAseq | -0.3010 | 0.2210 |
Upregulated datasets: 0; Downregulated datasets: 0.
Survival by C2orf15 expression:
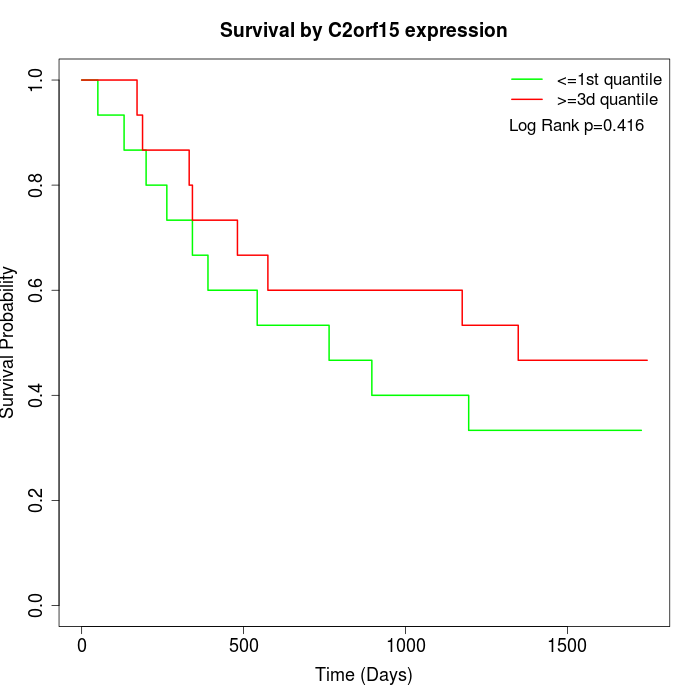 | 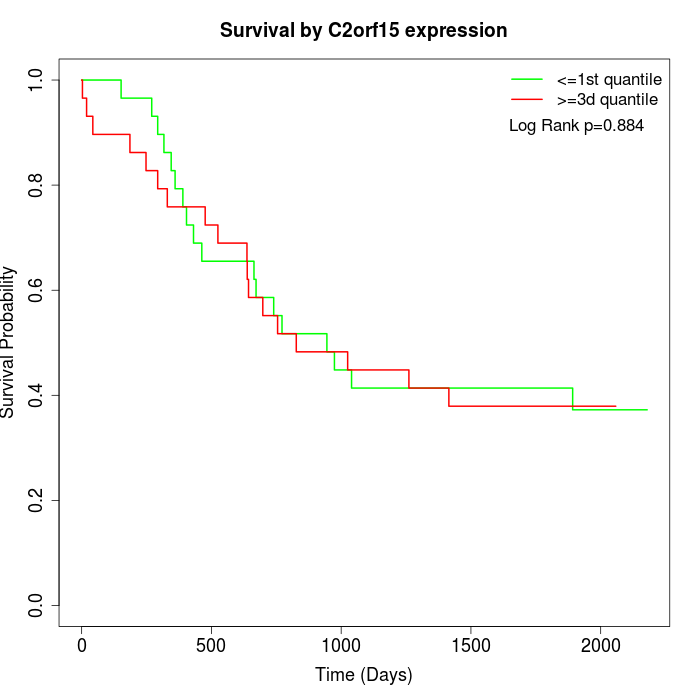 | 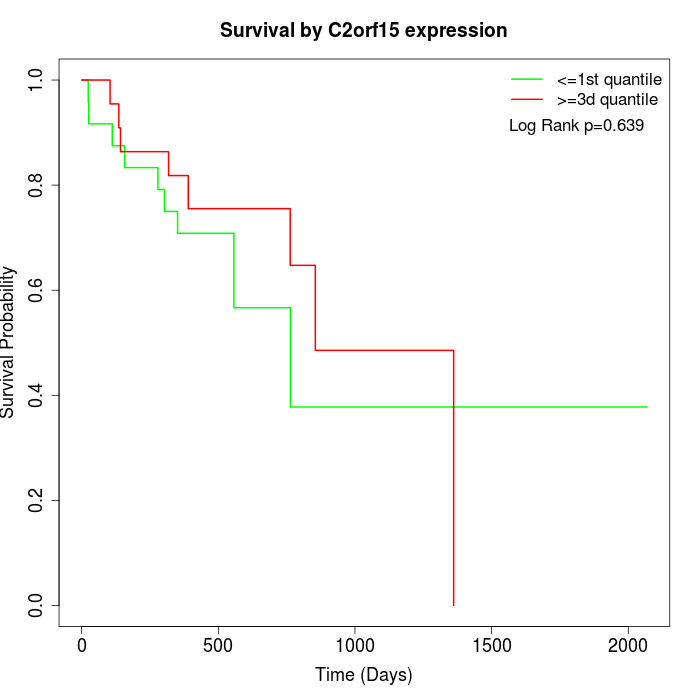 |
| GSE53622 | GSE53624 | TCGA |
Note: Click image to view full size file.
Copy number change of C2orf15:
| Dataset | Gene | EntrezID | Gain | Loss | Normal | Detail |
|---|---|---|---|---|---|---|
| GSE15526 | C2orf15 | 150590 | 6 | 2 | 22 | |
| GSE20123 | C2orf15 | 150590 | 6 | 2 | 22 | |
| GSE43470 | C2orf15 | 150590 | 3 | 1 | 39 | |
| GSE46452 | C2orf15 | 150590 | 2 | 3 | 54 | |
| GSE47630 | C2orf15 | 150590 | 7 | 0 | 33 | |
| GSE54993 | C2orf15 | 150590 | 0 | 6 | 64 | |
| GSE54994 | C2orf15 | 150590 | 10 | 0 | 43 | |
| GSE60625 | C2orf15 | 150590 | 0 | 3 | 8 | |
| GSE74703 | C2orf15 | 150590 | 3 | 1 | 32 | |
| GSE74704 | C2orf15 | 150590 | 4 | 1 | 15 | |
| TCGA | C2orf15 | 150590 | 34 | 4 | 58 |
Total number of gains: 75; Total number of losses: 23; Total Number of normals: 390.
Somatic mutations of C2orf15:
Generating mutation plots.
Highly correlated genes for C2orf15:
Showing top 20/33 corelated genes with mean PCC>0.5.
| Gene1 | Gene2 | Mean PCC | Num. Datasets | Num. PCC<0 | Num. PCC>0.5 |
|---|---|---|---|---|---|
| C2orf15 | HEXIM1 | 0.631812 | 3 | 0 | 3 |
| C2orf15 | TM7SF2 | 0.624334 | 3 | 0 | 3 |
| C2orf15 | CDC42BPG | 0.622101 | 3 | 0 | 3 |
| C2orf15 | WDSUB1 | 0.619048 | 3 | 0 | 3 |
| C2orf15 | CEP76 | 0.617959 | 3 | 0 | 3 |
| C2orf15 | ZNF75A | 0.613683 | 3 | 0 | 3 |
| C2orf15 | TSTD1 | 0.585313 | 3 | 0 | 3 |
| C2orf15 | HOOK2 | 0.584567 | 4 | 0 | 3 |
| C2orf15 | RNF43 | 0.583528 | 4 | 0 | 3 |
| C2orf15 | AHCYL2 | 0.578436 | 3 | 0 | 3 |
| C2orf15 | ABAT | 0.576624 | 3 | 0 | 3 |
| C2orf15 | FGFBP3 | 0.57565 | 4 | 0 | 3 |
| C2orf15 | CAMSAP3 | 0.573663 | 3 | 0 | 3 |
| C2orf15 | GOSR1 | 0.568952 | 4 | 0 | 3 |
| C2orf15 | ZFP3 | 0.565508 | 3 | 0 | 3 |
| C2orf15 | ZFP14 | 0.564831 | 3 | 0 | 3 |
| C2orf15 | ZNF224 | 0.558266 | 4 | 0 | 3 |
| C2orf15 | IL20RA | 0.551709 | 3 | 0 | 3 |
| C2orf15 | COX5B | 0.540401 | 5 | 0 | 3 |
| C2orf15 | MRPL30 | 0.540011 | 6 | 0 | 3 |
For details and further investigation, click here