| Full name: centrosomal protein 192 | Alias Symbol: KIAA1569|FLJ10352|PPP1R62 | ||
| Type: protein-coding gene | Cytoband: 18p11.21 | ||
| Entrez ID: 55125 | HGNC ID: HGNC:25515 | Ensembl Gene: ENSG00000101639 | OMIM ID: 616426 |
Screen Evidence:
| |||
Expression of CEP192:
| Dataset | Gene | EntrezID | Probe | Log2FC | Adj.pValue | Expression |
|---|---|---|---|---|---|---|
| GSE17351 | CEP192 | 55125 | 218827_s_at | 0.4297 | 0.4361 | |
| GSE20347 | CEP192 | 55125 | 218827_s_at | 0.7312 | 0.0006 | |
| GSE23400 | CEP192 | 55125 | 218827_s_at | 0.3649 | 0.0000 | |
| GSE26886 | CEP192 | 55125 | 218827_s_at | 0.6901 | 0.0108 | |
| GSE29001 | CEP192 | 55125 | 218827_s_at | 0.9411 | 0.0078 | |
| GSE38129 | CEP192 | 55125 | 218827_s_at | 0.7408 | 0.0000 | |
| GSE45670 | CEP192 | 55125 | 218827_s_at | 0.3734 | 0.0493 | |
| GSE53622 | CEP192 | 55125 | 18569 | 0.2386 | 0.0586 | |
| GSE53624 | CEP192 | 55125 | 18569 | 0.4785 | 0.0000 | |
| GSE63941 | CEP192 | 55125 | 218827_s_at | 0.5086 | 0.3141 | |
| GSE77861 | CEP192 | 55125 | 218827_s_at | 0.3960 | 0.2497 | |
| GSE97050 | CEP192 | 55125 | A_23_P89710 | -0.1021 | 0.6633 | |
| SRP007169 | CEP192 | 55125 | RNAseq | 0.6934 | 0.0507 | |
| SRP008496 | CEP192 | 55125 | RNAseq | 0.5411 | 0.0241 | |
| SRP064894 | CEP192 | 55125 | RNAseq | 0.5082 | 0.1005 | |
| SRP133303 | CEP192 | 55125 | RNAseq | 0.6195 | 0.0021 | |
| SRP159526 | CEP192 | 55125 | RNAseq | 0.6094 | 0.1220 | |
| SRP193095 | CEP192 | 55125 | RNAseq | 0.4955 | 0.0000 | |
| SRP219564 | CEP192 | 55125 | RNAseq | -0.0349 | 0.8567 | |
| TCGA | CEP192 | 55125 | RNAseq | -0.0198 | 0.7320 |
Upregulated datasets: 0; Downregulated datasets: 0.
Survival by CEP192 expression:
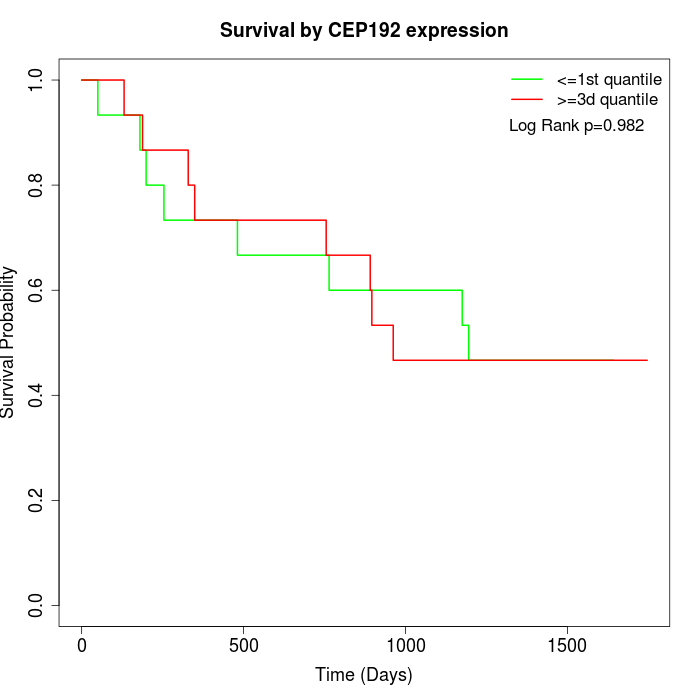 | 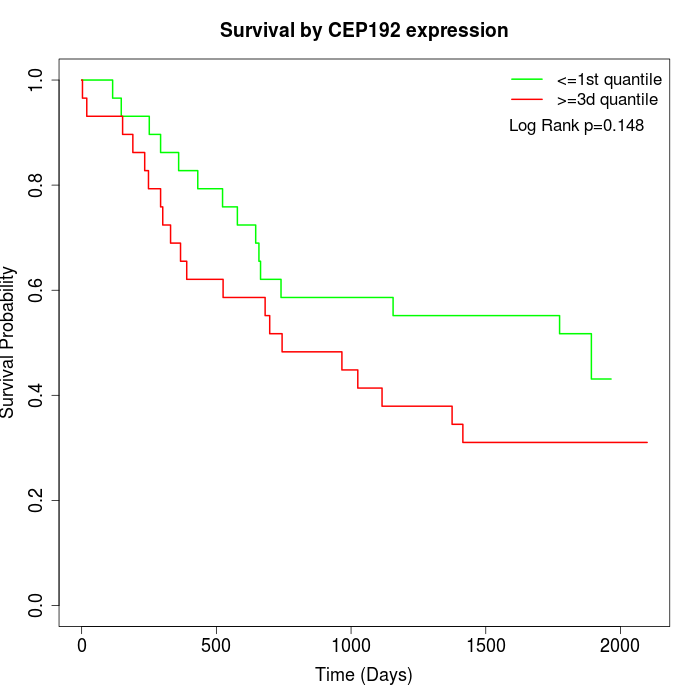 | 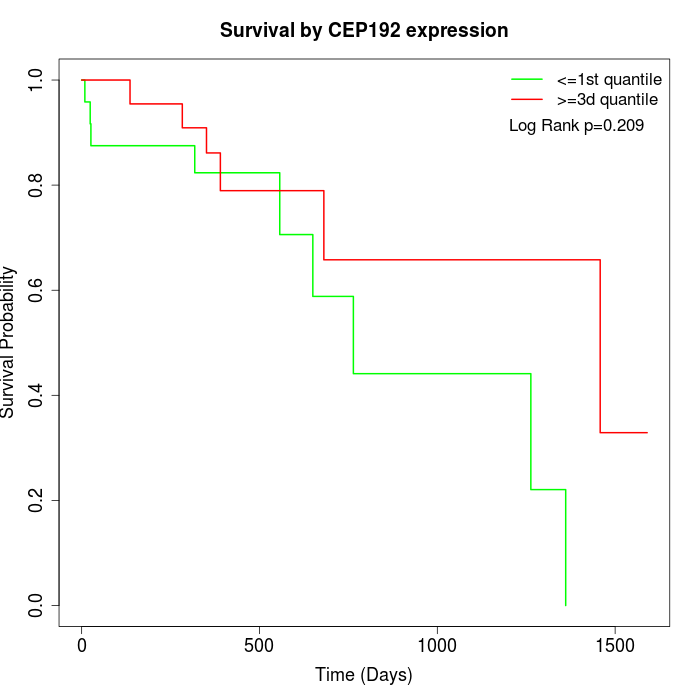 |
| GSE53622 | GSE53624 | TCGA |
Note: Click image to view full size file.
Copy number change of CEP192:
| Dataset | Gene | EntrezID | Gain | Loss | Normal | Detail |
|---|---|---|---|---|---|---|
| GSE15526 | CEP192 | 55125 | 5 | 3 | 22 | |
| GSE20123 | CEP192 | 55125 | 5 | 3 | 22 | |
| GSE43470 | CEP192 | 55125 | 0 | 6 | 37 | |
| GSE46452 | CEP192 | 55125 | 3 | 21 | 35 | |
| GSE47630 | CEP192 | 55125 | 7 | 17 | 16 | |
| GSE54993 | CEP192 | 55125 | 6 | 2 | 62 | |
| GSE54994 | CEP192 | 55125 | 8 | 8 | 37 | |
| GSE60625 | CEP192 | 55125 | 0 | 4 | 7 | |
| GSE74703 | CEP192 | 55125 | 0 | 4 | 32 | |
| GSE74704 | CEP192 | 55125 | 3 | 2 | 15 | |
| TCGA | CEP192 | 55125 | 29 | 23 | 44 |
Total number of gains: 66; Total number of losses: 93; Total Number of normals: 329.
Somatic mutations of CEP192:
Generating mutation plots.
Highly correlated genes for CEP192:
Showing top 20/1167 corelated genes with mean PCC>0.5.
| Gene1 | Gene2 | Mean PCC | Num. Datasets | Num. PCC<0 | Num. PCC>0.5 |
|---|---|---|---|---|---|
| CEP192 | FH | 0.778162 | 3 | 0 | 3 |
| CEP192 | GAS2L1 | 0.771899 | 3 | 0 | 3 |
| CEP192 | DHRSX | 0.764036 | 3 | 0 | 3 |
| CEP192 | ACBD5 | 0.759784 | 3 | 0 | 3 |
| CEP192 | NSMCE2 | 0.75914 | 3 | 0 | 3 |
| CEP192 | IRAK1BP1 | 0.73757 | 3 | 0 | 3 |
| CEP192 | RALGAPA1 | 0.73717 | 3 | 0 | 3 |
| CEP192 | SORL1 | 0.728849 | 3 | 0 | 3 |
| CEP192 | BBS4 | 0.720718 | 4 | 0 | 4 |
| CEP192 | KCNE3 | 0.720686 | 3 | 0 | 3 |
| CEP192 | ZCCHC3 | 0.718132 | 4 | 0 | 4 |
| CEP192 | SESTD1 | 0.715681 | 3 | 0 | 3 |
| CEP192 | ZSCAN21 | 0.710253 | 3 | 0 | 3 |
| CEP192 | PTPN2 | 0.706341 | 12 | 0 | 11 |
| CEP192 | INTS4 | 0.694685 | 4 | 0 | 3 |
| CEP192 | ZNF641 | 0.689265 | 4 | 0 | 3 |
| CEP192 | TATDN1 | 0.688852 | 4 | 0 | 4 |
| CEP192 | C1orf131 | 0.687456 | 6 | 0 | 5 |
| CEP192 | ZNF680 | 0.681693 | 3 | 0 | 3 |
| CEP192 | ZMYND19 | 0.680715 | 3 | 0 | 3 |
For details and further investigation, click here