| Full name: ciliary neurotrophic factor receptor | Alias Symbol: | ||
| Type: protein-coding gene | Cytoband: 9p13.3 | ||
| Entrez ID: 1271 | HGNC ID: HGNC:2170 | Ensembl Gene: ENSG00000122756 | OMIM ID: 118946 |
| Related drugs: PHYSOSTIGMINE SULFATE, PRILOCAINE, RALOXIFENE, SCH-37370... [more] | |||
CNTFR involved pathways:
| KEGG pathway | Description | View |
|---|---|---|
| hsa04630 | Jak-STAT signaling pathway |
Expression of CNTFR:
| Dataset | Gene | EntrezID | Probe | Log2FC | Adj.pValue | Expression |
|---|---|---|---|---|---|---|
| GSE17351 | CNTFR | 1271 | 205723_at | -0.2097 | 0.2419 | |
| GSE20347 | CNTFR | 1271 | 205723_at | -0.0957 | 0.2849 | |
| GSE23400 | CNTFR | 1271 | 205723_at | -0.2136 | 0.0000 | |
| GSE26886 | CNTFR | 1271 | 205723_at | -0.3172 | 0.0682 | |
| GSE29001 | CNTFR | 1271 | 205723_at | -0.2799 | 0.0788 | |
| GSE38129 | CNTFR | 1271 | 205723_at | -0.2502 | 0.0050 | |
| GSE45670 | CNTFR | 1271 | 205723_at | 0.1654 | 0.0676 | |
| GSE53622 | CNTFR | 1271 | 87505 | -0.0799 | 0.8315 | |
| GSE53624 | CNTFR | 1271 | 87505 | -0.1431 | 0.5748 | |
| GSE63941 | CNTFR | 1271 | 205723_at | 0.0303 | 0.8929 | |
| GSE77861 | CNTFR | 1271 | 205723_at | -0.0678 | 0.4115 | |
| SRP159526 | CNTFR | 1271 | RNAseq | -0.1198 | 0.8931 | |
| TCGA | CNTFR | 1271 | RNAseq | -1.4235 | 0.0032 |
Upregulated datasets: 0; Downregulated datasets: 1.
Survival by CNTFR expression:
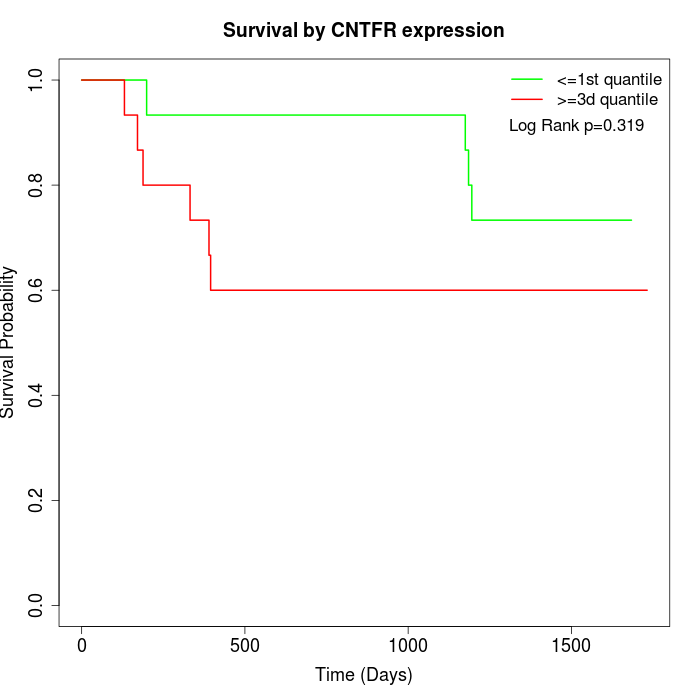 |  | 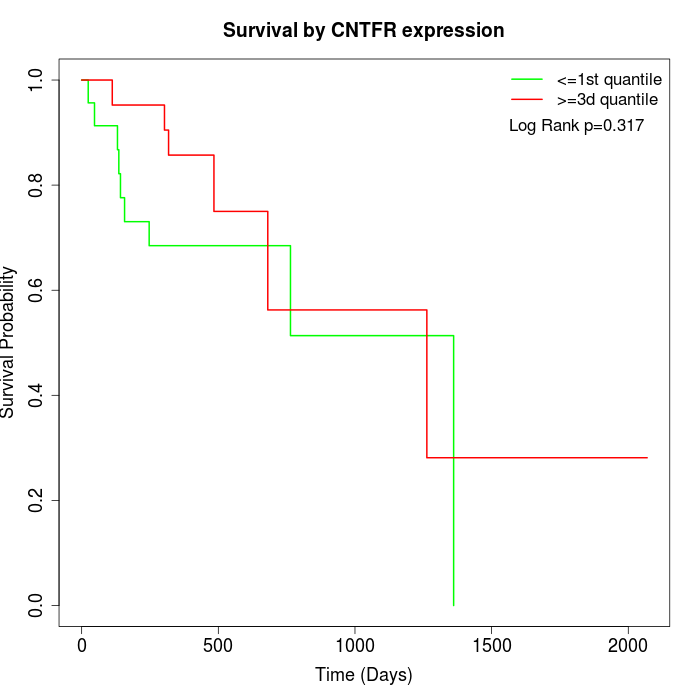 |
| GSE53622 | GSE53624 | TCGA |
Note: Click image to view full size file.
Copy number change of CNTFR:
| Dataset | Gene | EntrezID | Gain | Loss | Normal | Detail |
|---|---|---|---|---|---|---|
| GSE15526 | CNTFR | 1271 | 4 | 13 | 13 | |
| GSE20123 | CNTFR | 1271 | 4 | 13 | 13 | |
| GSE43470 | CNTFR | 1271 | 3 | 10 | 30 | |
| GSE46452 | CNTFR | 1271 | 6 | 15 | 38 | |
| GSE47630 | CNTFR | 1271 | 1 | 20 | 19 | |
| GSE54993 | CNTFR | 1271 | 6 | 0 | 64 | |
| GSE54994 | CNTFR | 1271 | 6 | 12 | 35 | |
| GSE60625 | CNTFR | 1271 | 0 | 0 | 11 | |
| GSE74703 | CNTFR | 1271 | 2 | 7 | 27 | |
| GSE74704 | CNTFR | 1271 | 0 | 11 | 9 | |
| TCGA | CNTFR | 1271 | 17 | 44 | 35 |
Total number of gains: 49; Total number of losses: 145; Total Number of normals: 294.
Somatic mutations of CNTFR:
Generating mutation plots.
Highly correlated genes for CNTFR:
Showing top 20/758 corelated genes with mean PCC>0.5.
| Gene1 | Gene2 | Mean PCC | Num. Datasets | Num. PCC<0 | Num. PCC>0.5 |
|---|---|---|---|---|---|
| CNTFR | LCN8 | 0.775722 | 3 | 0 | 3 |
| CNTFR | SPNS3 | 0.739848 | 3 | 0 | 3 |
| CNTFR | STH | 0.726307 | 3 | 0 | 3 |
| CNTFR | ZNF710 | 0.712728 | 3 | 0 | 3 |
| CNTFR | LGALS2 | 0.679948 | 3 | 0 | 3 |
| CNTFR | ANKRD33 | 0.67714 | 4 | 0 | 4 |
| CNTFR | RECK | 0.676298 | 3 | 0 | 3 |
| CNTFR | DSCAML1 | 0.671498 | 4 | 0 | 3 |
| CNTFR | MYO1A | 0.669121 | 7 | 0 | 7 |
| CNTFR | ARX | 0.667972 | 3 | 0 | 3 |
| CNTFR | CYP2A6 | 0.662017 | 6 | 0 | 6 |
| CNTFR | DBNDD1 | 0.661726 | 4 | 0 | 4 |
| CNTFR | CD300LG | 0.659514 | 4 | 0 | 4 |
| CNTFR | LINC00334 | 0.652402 | 3 | 0 | 3 |
| CNTFR | TMEM132B | 0.649667 | 3 | 0 | 3 |
| CNTFR | S100A5 | 0.649424 | 4 | 0 | 3 |
| CNTFR | ART1 | 0.646651 | 5 | 0 | 5 |
| CNTFR | JAK3 | 0.644367 | 4 | 0 | 4 |
| CNTFR | ZNF568 | 0.640051 | 3 | 0 | 3 |
| CNTFR | PCSK6 | 0.640048 | 5 | 0 | 5 |
For details and further investigation, click here