| Full name: S100 calcium binding protein A5 | Alias Symbol: | ||
| Type: protein-coding gene | Cytoband: 1q21.3 | ||
| Entrez ID: 6276 | HGNC ID: HGNC:10495 | Ensembl Gene: ENSG00000196420 | OMIM ID: 176991 |
Expression of S100A5:
| Dataset | Gene | EntrezID | Probe | Log2FC | Adj.pValue | Expression |
|---|---|---|---|---|---|---|
| GSE17351 | S100A5 | 6276 | 207763_at | 0.0904 | 0.7864 | |
| GSE20347 | S100A5 | 6276 | 207763_at | -0.1086 | 0.1668 | |
| GSE23400 | S100A5 | 6276 | 207763_at | -0.1275 | 0.0001 | |
| GSE26886 | S100A5 | 6276 | 207763_at | 0.1611 | 0.3019 | |
| GSE29001 | S100A5 | 6276 | 207763_at | -0.1626 | 0.2400 | |
| GSE38129 | S100A5 | 6276 | 207763_at | -0.1431 | 0.0165 | |
| GSE45670 | S100A5 | 6276 | 207763_at | 0.0069 | 0.9558 | |
| GSE53622 | S100A5 | 6276 | 71342 | 0.1570 | 0.0093 | |
| GSE53624 | S100A5 | 6276 | 71342 | -0.1566 | 0.0224 | |
| GSE63941 | S100A5 | 6276 | 207763_at | -0.0043 | 0.9841 | |
| GSE77861 | S100A5 | 6276 | 207763_at | -0.0066 | 0.9657 | |
| GSE97050 | S100A5 | 6276 | A_23_P115467 | -0.0486 | 0.8605 | |
| SRP159526 | S100A5 | 6276 | RNAseq | 2.0679 | 0.0026 | |
| TCGA | S100A5 | 6276 | RNAseq | 1.2170 | 0.0191 |
Upregulated datasets: 2; Downregulated datasets: 0.
Survival by S100A5 expression:
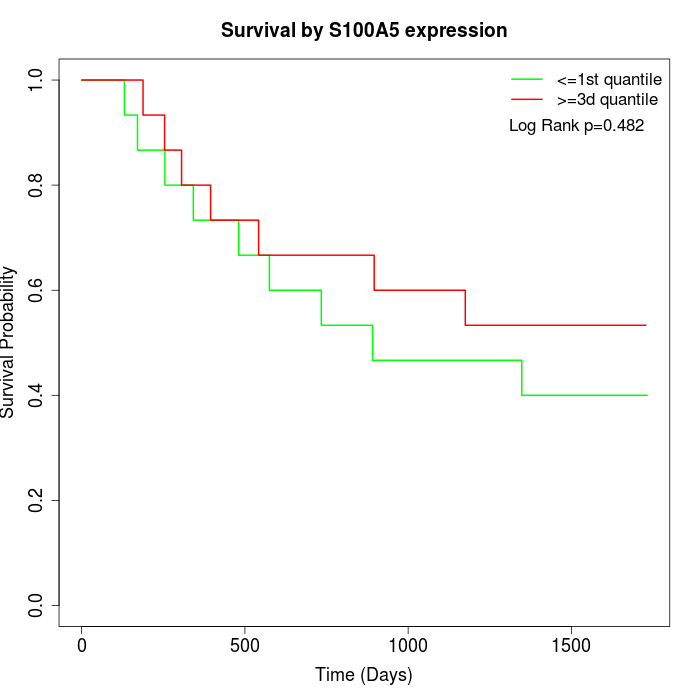 | 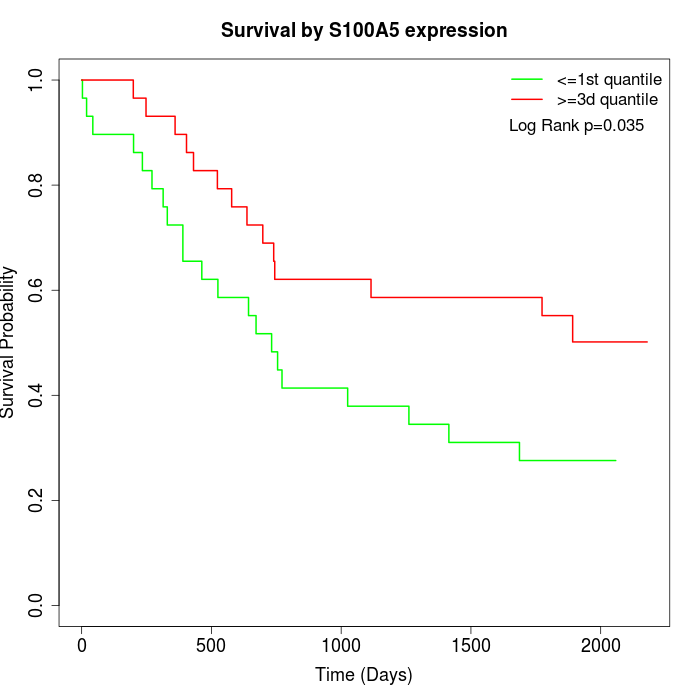 | 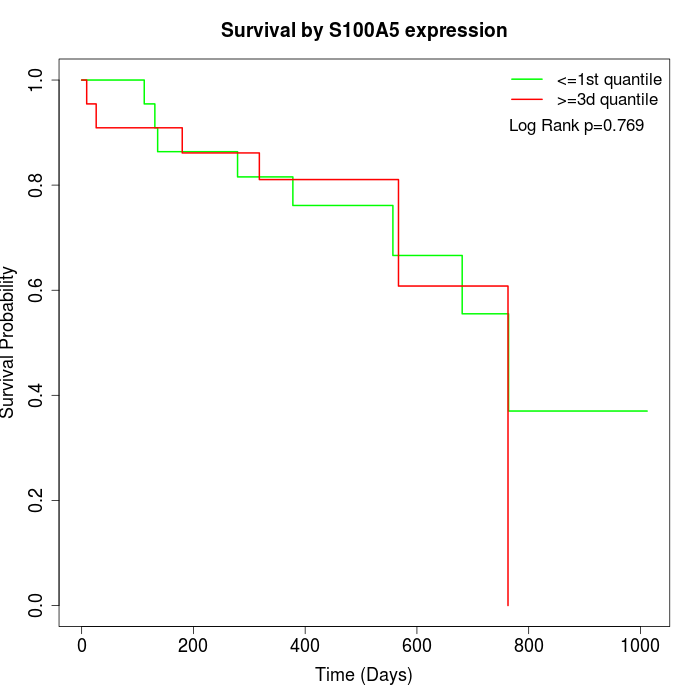 |
| GSE53622 | GSE53624 | TCGA |
Note: Click image to view full size file.
Copy number change of S100A5:
| Dataset | Gene | EntrezID | Gain | Loss | Normal | Detail |
|---|---|---|---|---|---|---|
| GSE15526 | S100A5 | 6276 | 14 | 0 | 16 | |
| GSE20123 | S100A5 | 6276 | 14 | 0 | 16 | |
| GSE43470 | S100A5 | 6276 | 6 | 2 | 35 | |
| GSE46452 | S100A5 | 6276 | 2 | 1 | 56 | |
| GSE47630 | S100A5 | 6276 | 15 | 0 | 25 | |
| GSE54993 | S100A5 | 6276 | 0 | 4 | 66 | |
| GSE54994 | S100A5 | 6276 | 16 | 0 | 37 | |
| GSE60625 | S100A5 | 6276 | 0 | 0 | 11 | |
| GSE74703 | S100A5 | 6276 | 6 | 1 | 29 | |
| GSE74704 | S100A5 | 6276 | 7 | 0 | 13 | |
| TCGA | S100A5 | 6276 | 39 | 1 | 56 |
Total number of gains: 119; Total number of losses: 9; Total Number of normals: 360.
Somatic mutations of S100A5:
Generating mutation plots.
Highly correlated genes for S100A5:
Showing top 20/606 corelated genes with mean PCC>0.5.
| Gene1 | Gene2 | Mean PCC | Num. Datasets | Num. PCC<0 | Num. PCC>0.5 |
|---|---|---|---|---|---|
| S100A5 | SBNO2 | 0.766324 | 3 | 0 | 3 |
| S100A5 | SYT1 | 0.745702 | 3 | 0 | 3 |
| S100A5 | AMHR2 | 0.727746 | 6 | 0 | 6 |
| S100A5 | ZC3H10 | 0.725603 | 3 | 0 | 3 |
| S100A5 | NLRP13 | 0.724186 | 3 | 0 | 3 |
| S100A5 | HMGCLL1 | 0.715916 | 3 | 0 | 3 |
| S100A5 | CELF5 | 0.710269 | 3 | 0 | 3 |
| S100A5 | LRFN2 | 0.697796 | 3 | 0 | 3 |
| S100A5 | PHF7 | 0.695199 | 5 | 0 | 4 |
| S100A5 | HK3 | 0.693727 | 4 | 0 | 4 |
| S100A5 | ITGA10 | 0.692665 | 4 | 0 | 3 |
| S100A5 | TNFSF11 | 0.688925 | 5 | 0 | 4 |
| S100A5 | IFNA4 | 0.687767 | 4 | 0 | 3 |
| S100A5 | IL1F10 | 0.684965 | 3 | 0 | 3 |
| S100A5 | IGSF9B | 0.683931 | 3 | 0 | 3 |
| S100A5 | CIB3 | 0.683095 | 3 | 0 | 3 |
| S100A5 | GFRA2 | 0.681395 | 5 | 0 | 4 |
| S100A5 | SPTBN5 | 0.680208 | 4 | 0 | 3 |
| S100A5 | MASP2 | 0.67991 | 5 | 0 | 4 |
| S100A5 | CEND1 | 0.679859 | 6 | 0 | 6 |
For details and further investigation, click here