| Full name: sphingolipid transporter 3 (putative) | Alias Symbol: MGC29671|SLC62A3 | ||
| Type: protein-coding gene | Cytoband: 17p13.2 | ||
| Entrez ID: 201305 | HGNC ID: HGNC:28433 | Ensembl Gene: ENSG00000182557 | OMIM ID: 611701 |
Expression of SPNS3:
| Dataset | Gene | EntrezID | Probe | Log2FC | Adj.pValue | Expression |
|---|---|---|---|---|---|---|
| GSE17351 | SPNS3 | 201305 | 235900_at | -0.2340 | 0.2492 | |
| GSE26886 | SPNS3 | 201305 | 235900_at | -0.2154 | 0.1627 | |
| GSE45670 | SPNS3 | 201305 | 235900_at | -0.0159 | 0.9018 | |
| GSE53622 | SPNS3 | 201305 | 45852 | -0.5349 | 0.0000 | |
| GSE53624 | SPNS3 | 201305 | 45852 | -0.6501 | 0.0000 | |
| GSE63941 | SPNS3 | 201305 | 235900_at | -0.1142 | 0.5666 | |
| GSE77861 | SPNS3 | 201305 | 235900_at | -0.2775 | 0.0556 | |
| GSE97050 | SPNS3 | 201305 | A_23_P100963 | -0.1018 | 0.7032 | |
| SRP133303 | SPNS3 | 201305 | RNAseq | -2.1020 | 0.0000 | |
| SRP159526 | SPNS3 | 201305 | RNAseq | -2.1463 | 0.0001 | |
| SRP219564 | SPNS3 | 201305 | RNAseq | -1.1066 | 0.0523 | |
| TCGA | SPNS3 | 201305 | RNAseq | -1.0860 | 0.0468 |
Upregulated datasets: 0; Downregulated datasets: 3.
Survival by SPNS3 expression:
 | 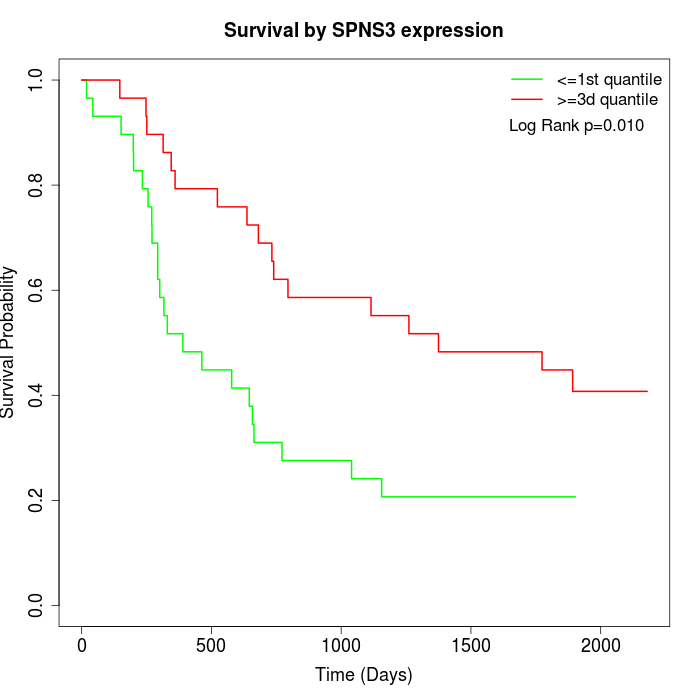 | 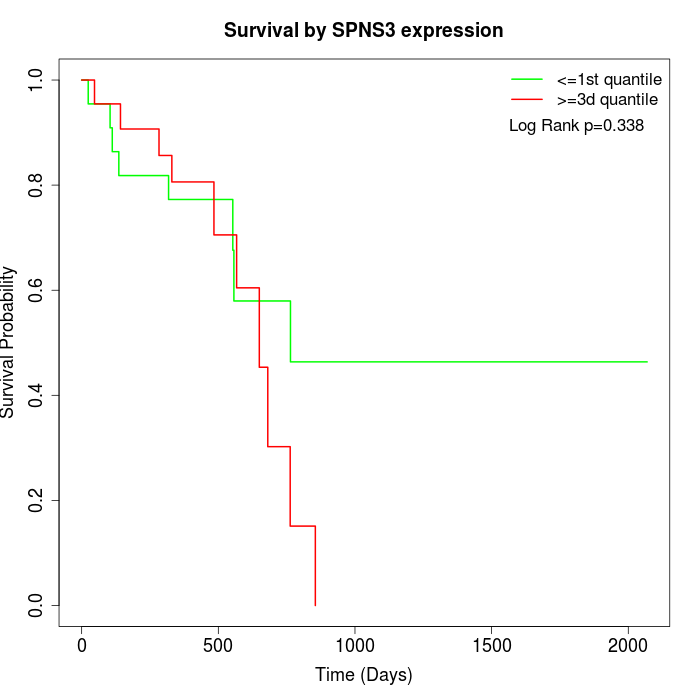 |
| GSE53622 | GSE53624 | TCGA |
Note: Click image to view full size file.
Copy number change of SPNS3:
| Dataset | Gene | EntrezID | Gain | Loss | Normal | Detail |
|---|---|---|---|---|---|---|
| GSE15526 | SPNS3 | 201305 | 5 | 2 | 23 | |
| GSE20123 | SPNS3 | 201305 | 5 | 3 | 22 | |
| GSE43470 | SPNS3 | 201305 | 1 | 6 | 36 | |
| GSE46452 | SPNS3 | 201305 | 34 | 1 | 24 | |
| GSE47630 | SPNS3 | 201305 | 7 | 1 | 32 | |
| GSE54993 | SPNS3 | 201305 | 4 | 3 | 63 | |
| GSE54994 | SPNS3 | 201305 | 5 | 9 | 39 | |
| GSE60625 | SPNS3 | 201305 | 4 | 0 | 7 | |
| GSE74703 | SPNS3 | 201305 | 1 | 3 | 32 | |
| GSE74704 | SPNS3 | 201305 | 3 | 1 | 16 | |
| TCGA | SPNS3 | 201305 | 19 | 21 | 56 |
Total number of gains: 88; Total number of losses: 50; Total Number of normals: 350.
Somatic mutations of SPNS3:
Generating mutation plots.
Highly correlated genes for SPNS3:
Showing top 20/519 corelated genes with mean PCC>0.5.
| Gene1 | Gene2 | Mean PCC | Num. Datasets | Num. PCC<0 | Num. PCC>0.5 |
|---|---|---|---|---|---|
| SPNS3 | PGLYRP1 | 0.806144 | 3 | 0 | 3 |
| SPNS3 | NOG | 0.770222 | 3 | 0 | 3 |
| SPNS3 | ADH6 | 0.765602 | 3 | 0 | 3 |
| SPNS3 | IGSF21 | 0.764917 | 3 | 0 | 3 |
| SPNS3 | CCL24 | 0.757543 | 3 | 0 | 3 |
| SPNS3 | FAM71A | 0.745322 | 4 | 0 | 4 |
| SPNS3 | CNTFR | 0.739848 | 3 | 0 | 3 |
| SPNS3 | SLC25A48 | 0.724403 | 3 | 0 | 3 |
| SPNS3 | KCNQ4 | 0.720725 | 3 | 0 | 3 |
| SPNS3 | CARS-AS1 | 0.720575 | 3 | 0 | 3 |
| SPNS3 | LINC00841 | 0.715399 | 4 | 0 | 4 |
| SPNS3 | C10orf90 | 0.704452 | 3 | 0 | 3 |
| SPNS3 | CYP2D6 | 0.70325 | 3 | 0 | 3 |
| SPNS3 | KLKB1 | 0.698886 | 6 | 0 | 6 |
| SPNS3 | TSSK2 | 0.695697 | 3 | 0 | 3 |
| SPNS3 | ARSE | 0.694021 | 3 | 0 | 3 |
| SPNS3 | ENHO | 0.689991 | 5 | 0 | 4 |
| SPNS3 | TULP2 | 0.689546 | 5 | 0 | 5 |
| SPNS3 | C11orf21 | 0.689198 | 4 | 0 | 4 |
| SPNS3 | C7orf61 | 0.688467 | 3 | 0 | 3 |
For details and further investigation, click here