| Full name: dysbindin domain containing 1 | Alias Symbol: MGC3101|FLJ12582 | ||
| Type: protein-coding gene | Cytoband: 16q24.3 | ||
| Entrez ID: 79007 | HGNC ID: HGNC:28455 | Ensembl Gene: ENSG00000003249 | OMIM ID: |
Expression of DBNDD1:
| Dataset | Gene | EntrezID | Probe | Log2FC | Adj.pValue | Expression |
|---|---|---|---|---|---|---|
| GSE17351 | DBNDD1 | 79007 | 222234_s_at | -0.7293 | 0.3031 | |
| GSE20347 | DBNDD1 | 79007 | 222234_s_at | -1.1329 | 0.0000 | |
| GSE23400 | DBNDD1 | 79007 | 222234_s_at | -0.4437 | 0.0000 | |
| GSE26886 | DBNDD1 | 79007 | 222234_s_at | -0.6246 | 0.0005 | |
| GSE29001 | DBNDD1 | 79007 | 222234_s_at | -0.7726 | 0.0003 | |
| GSE38129 | DBNDD1 | 79007 | 222234_s_at | -0.7602 | 0.0000 | |
| GSE45670 | DBNDD1 | 79007 | 222234_s_at | -0.3268 | 0.0835 | |
| GSE53622 | DBNDD1 | 79007 | 8643 | -1.7313 | 0.0000 | |
| GSE53624 | DBNDD1 | 79007 | 16493 | -1.2877 | 0.0000 | |
| GSE63941 | DBNDD1 | 79007 | 222234_s_at | 0.2092 | 0.6819 | |
| GSE77861 | DBNDD1 | 79007 | 222234_s_at | -0.4914 | 0.0560 | |
| GSE97050 | DBNDD1 | 79007 | A_23_P26439 | -0.2745 | 0.3509 | |
| SRP007169 | DBNDD1 | 79007 | RNAseq | -2.2299 | 0.0000 | |
| SRP008496 | DBNDD1 | 79007 | RNAseq | -2.5763 | 0.0000 | |
| SRP064894 | DBNDD1 | 79007 | RNAseq | -1.7649 | 0.0000 | |
| SRP133303 | DBNDD1 | 79007 | RNAseq | -1.7226 | 0.0000 | |
| SRP159526 | DBNDD1 | 79007 | RNAseq | -1.0413 | 0.0163 | |
| SRP193095 | DBNDD1 | 79007 | RNAseq | -1.2434 | 0.0000 | |
| SRP219564 | DBNDD1 | 79007 | RNAseq | -1.9929 | 0.0005 | |
| TCGA | DBNDD1 | 79007 | RNAseq | -0.1286 | 0.3437 |
Upregulated datasets: 0; Downregulated datasets: 10.
Survival by DBNDD1 expression:
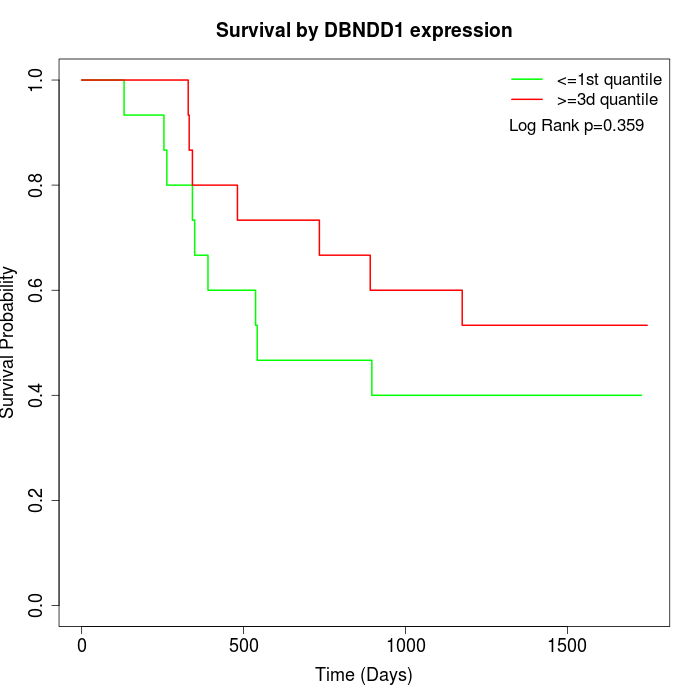 | 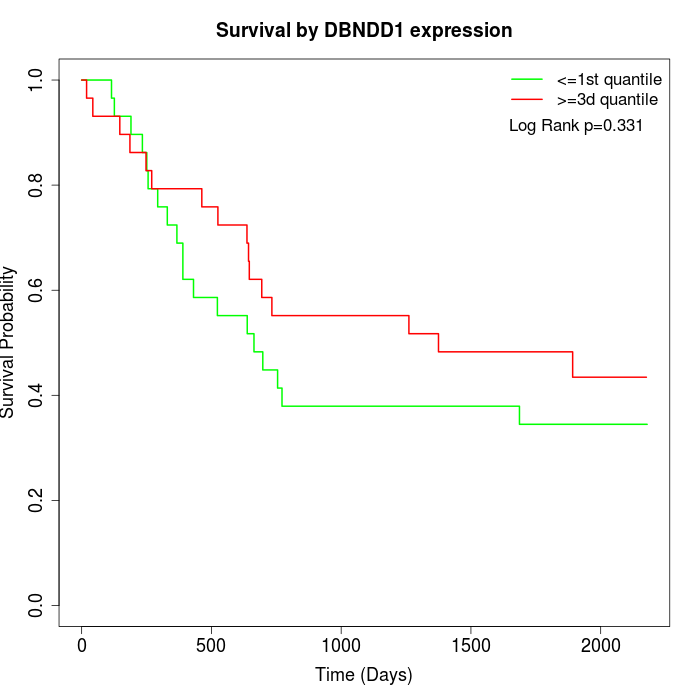 | 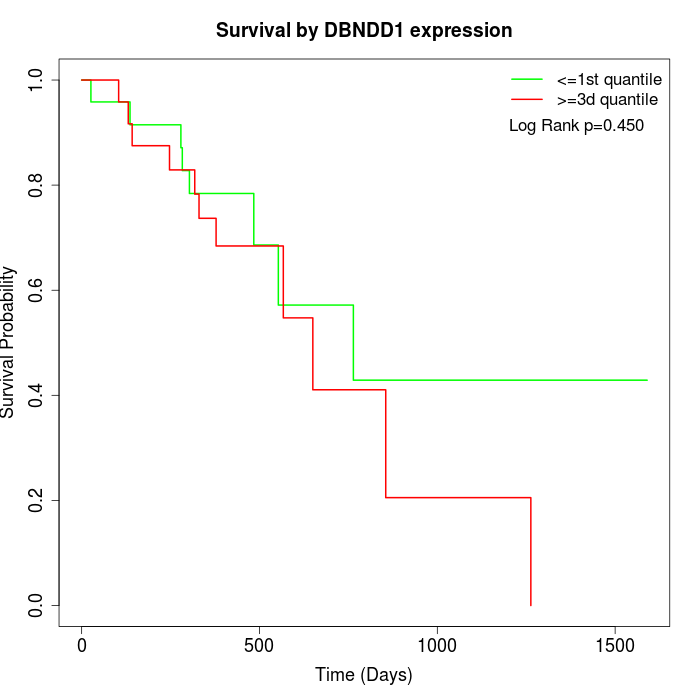 |
| GSE53622 | GSE53624 | TCGA |
Note: Click image to view full size file.
Copy number change of DBNDD1:
| Dataset | Gene | EntrezID | Gain | Loss | Normal | Detail |
|---|---|---|---|---|---|---|
| GSE15526 | DBNDD1 | 79007 | 4 | 3 | 23 | |
| GSE20123 | DBNDD1 | 79007 | 4 | 3 | 23 | |
| GSE43470 | DBNDD1 | 79007 | 1 | 13 | 29 | |
| GSE46452 | DBNDD1 | 79007 | 38 | 1 | 20 | |
| GSE47630 | DBNDD1 | 79007 | 11 | 9 | 20 | |
| GSE54993 | DBNDD1 | 79007 | 3 | 4 | 63 | |
| GSE54994 | DBNDD1 | 79007 | 9 | 11 | 33 | |
| GSE60625 | DBNDD1 | 79007 | 4 | 0 | 7 | |
| GSE74703 | DBNDD1 | 79007 | 1 | 9 | 26 | |
| GSE74704 | DBNDD1 | 79007 | 3 | 1 | 16 | |
| TCGA | DBNDD1 | 79007 | 26 | 15 | 55 |
Total number of gains: 104; Total number of losses: 69; Total Number of normals: 315.
Somatic mutations of DBNDD1:
Generating mutation plots.
Highly correlated genes for DBNDD1:
Showing top 20/1536 corelated genes with mean PCC>0.5.
| Gene1 | Gene2 | Mean PCC | Num. Datasets | Num. PCC<0 | Num. PCC>0.5 |
|---|---|---|---|---|---|
| DBNDD1 | SCNN1B | 0.798852 | 11 | 0 | 11 |
| DBNDD1 | RMND5B | 0.786815 | 10 | 0 | 10 |
| DBNDD1 | EHD3 | 0.779958 | 10 | 0 | 10 |
| DBNDD1 | ULK3 | 0.777197 | 6 | 0 | 6 |
| DBNDD1 | SH3GL1 | 0.774634 | 10 | 0 | 10 |
| DBNDD1 | MMEL1 | 0.771325 | 4 | 0 | 4 |
| DBNDD1 | C18orf25 | 0.771032 | 9 | 0 | 9 |
| DBNDD1 | EPS8L2 | 0.767053 | 11 | 0 | 11 |
| DBNDD1 | TRIP10 | 0.764353 | 11 | 0 | 11 |
| DBNDD1 | EPS8L1 | 0.761364 | 11 | 0 | 11 |
| DBNDD1 | VSIG10L | 0.759435 | 7 | 0 | 7 |
| DBNDD1 | GYS2 | 0.75734 | 10 | 0 | 9 |
| DBNDD1 | TOM1 | 0.756973 | 10 | 0 | 10 |
| DBNDD1 | EVPL | 0.755339 | 12 | 0 | 11 |
| DBNDD1 | GDPD3 | 0.748596 | 12 | 0 | 10 |
| DBNDD1 | SLC35C1 | 0.74837 | 10 | 0 | 10 |
| DBNDD1 | UPK3B | 0.743289 | 3 | 0 | 3 |
| DBNDD1 | SLURP1 | 0.742084 | 11 | 0 | 10 |
| DBNDD1 | IL36A | 0.741877 | 11 | 0 | 10 |
| DBNDD1 | GRHL3 | 0.741734 | 7 | 0 | 7 |
For details and further investigation, click here