| Full name: diphthamine biosynthesis 6 | Alias Symbol: MGC14798 | ||
| Type: protein-coding gene | Cytoband: 15q14 | ||
| Entrez ID: 89978 | HGNC ID: HGNC:30543 | Ensembl Gene: ENSG00000134146 | OMIM ID: 618391 |
Screen Evidence:
| |||
Expression of DPH6:
| Dataset | Gene | EntrezID | Probe | Log2FC | Adj.pValue | Expression |
|---|---|---|---|---|---|---|
| GSE17351 | DPH6 | 89978 | 238662_at | -0.1993 | 0.7843 | |
| GSE26886 | DPH6 | 89978 | 238662_at | 0.2906 | 0.2151 | |
| GSE45670 | DPH6 | 89978 | 238662_at | 0.0409 | 0.8620 | |
| GSE53622 | DPH6 | 89978 | 7861 | 0.4086 | 0.0000 | |
| GSE53624 | DPH6 | 89978 | 7861 | 0.1029 | 0.2544 | |
| GSE63941 | DPH6 | 89978 | 238662_at | 1.2662 | 0.0194 | |
| GSE77861 | DPH6 | 89978 | 238662_at | -0.2220 | 0.5336 | |
| SRP007169 | DPH6 | 89978 | RNAseq | 0.3149 | 0.5242 | |
| SRP064894 | DPH6 | 89978 | RNAseq | -0.2052 | 0.3166 | |
| SRP133303 | DPH6 | 89978 | RNAseq | 0.2004 | 0.3095 | |
| SRP159526 | DPH6 | 89978 | RNAseq | -0.0399 | 0.9272 | |
| SRP193095 | DPH6 | 89978 | RNAseq | -0.0934 | 0.2900 | |
| SRP219564 | DPH6 | 89978 | RNAseq | -0.3005 | 0.2976 |
Upregulated datasets: 1; Downregulated datasets: 0.
Survival by DPH6 expression:
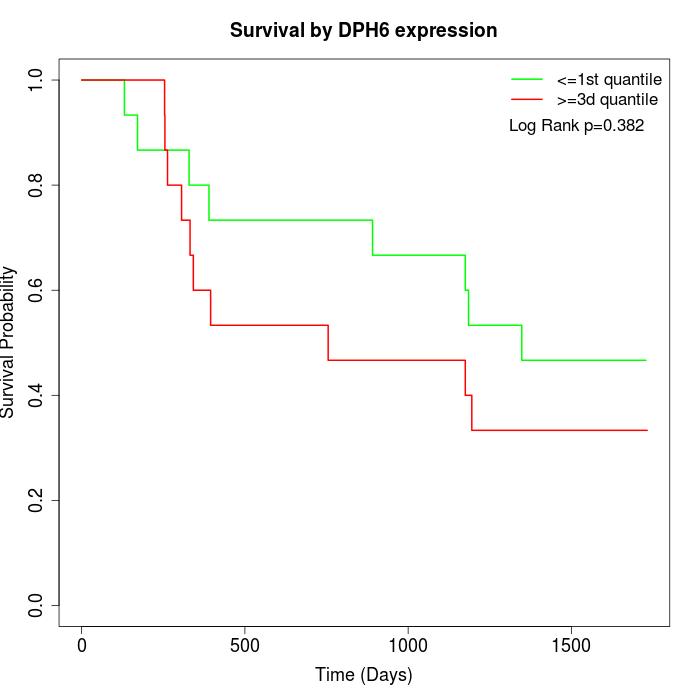 | 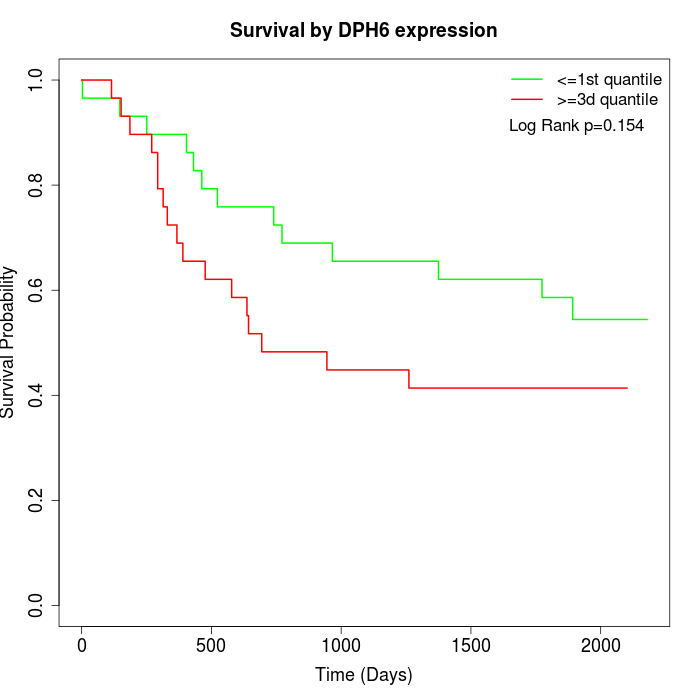 |
| GSE53622 | GSE53624 |
Note: Click image to view full size file.
Copy number change of DPH6:
| Dataset | Gene | EntrezID | Gain | Loss | Normal | Detail |
|---|---|---|---|---|---|---|
| GSE15526 | DPH6 | 89978 | 3 | 6 | 21 | |
| GSE20123 | DPH6 | 89978 | 3 | 6 | 21 | |
| GSE43470 | DPH6 | 89978 | 4 | 4 | 35 | |
| GSE46452 | DPH6 | 89978 | 3 | 7 | 49 | |
| GSE47630 | DPH6 | 89978 | 8 | 11 | 21 | |
| GSE54993 | DPH6 | 89978 | 4 | 6 | 60 | |
| GSE54994 | DPH6 | 89978 | 5 | 7 | 41 | |
| GSE60625 | DPH6 | 89978 | 4 | 0 | 7 | |
| GSE74703 | DPH6 | 89978 | 4 | 3 | 29 | |
| GSE74704 | DPH6 | 89978 | 2 | 5 | 13 | |
| TCGA | DPH6 | 89978 | 11 | 19 | 66 |
Total number of gains: 51; Total number of losses: 74; Total Number of normals: 363.
Somatic mutations of DPH6:
Generating mutation plots.
Highly correlated genes for DPH6:
Showing all 12 correlated genes with mean PCC>0.5.
| Gene1 | Gene2 | Mean PCC | Num. Datasets | Num. PCC<0 | Num. PCC>0.5 |
|---|---|---|---|---|---|
| DPH6 | FGFBP1 | 0.701906 | 3 | 0 | 3 |
| DPH6 | VSNL1 | 0.658975 | 3 | 0 | 3 |
| DPH6 | MRPL46 | 0.657352 | 3 | 0 | 3 |
| DPH6 | GOT1 | 0.616241 | 3 | 0 | 3 |
| DPH6 | PGAP2 | 0.599253 | 3 | 0 | 3 |
| DPH6 | PARN | 0.572721 | 3 | 0 | 3 |
| DPH6 | AQR | 0.568543 | 5 | 0 | 3 |
| DPH6 | LRRC28 | 0.546183 | 4 | 0 | 3 |
| DPH6 | MRPL57 | 0.539391 | 5 | 0 | 3 |
| DPH6 | HOGA1 | 0.527119 | 4 | 0 | 3 |
| DPH6 | TUBGCP4 | 0.526154 | 5 | 0 | 3 |
| DPH6 | HOMER2 | 0.518706 | 3 | 0 | 3 |
For details and further investigation, click here