| Full name: glutamic-oxaloacetic transaminase 1 | Alias Symbol: AST1 | ||
| Type: protein-coding gene | Cytoband: 10q24.2 | ||
| Entrez ID: 2805 | HGNC ID: HGNC:4432 | Ensembl Gene: ENSG00000120053 | OMIM ID: 138180 |
Screen Evidence:
| |||
Expression of GOT1:
| Dataset | Gene | EntrezID | Probe | Log2FC | Adj.pValue | Expression |
|---|---|---|---|---|---|---|
| GSE17351 | GOT1 | 2805 | 208813_at | -0.3932 | 0.3001 | |
| GSE20347 | GOT1 | 2805 | 208813_at | -0.4032 | 0.0475 | |
| GSE23400 | GOT1 | 2805 | 208813_at | -0.3315 | 0.0000 | |
| GSE26886 | GOT1 | 2805 | 208813_at | -0.6544 | 0.0012 | |
| GSE29001 | GOT1 | 2805 | 208813_at | -0.6730 | 0.0438 | |
| GSE38129 | GOT1 | 2805 | 208813_at | -0.1934 | 0.2884 | |
| GSE45670 | GOT1 | 2805 | 208813_at | -0.0098 | 0.9652 | |
| GSE53622 | GOT1 | 2805 | 109482 | -0.3597 | 0.0000 | |
| GSE53624 | GOT1 | 2805 | 109482 | -0.2984 | 0.0000 | |
| GSE63941 | GOT1 | 2805 | 208813_at | 1.7401 | 0.0042 | |
| GSE77861 | GOT1 | 2805 | 208813_at | -0.3294 | 0.2390 | |
| GSE97050 | GOT1 | 2805 | A_23_P63825 | 0.0560 | 0.8639 | |
| SRP007169 | GOT1 | 2805 | RNAseq | -0.9704 | 0.0116 | |
| SRP008496 | GOT1 | 2805 | RNAseq | -1.0059 | 0.0008 | |
| SRP064894 | GOT1 | 2805 | RNAseq | -0.5062 | 0.0030 | |
| SRP133303 | GOT1 | 2805 | RNAseq | -0.3027 | 0.0810 | |
| SRP159526 | GOT1 | 2805 | RNAseq | 0.1101 | 0.7816 | |
| SRP193095 | GOT1 | 2805 | RNAseq | -0.3124 | 0.0128 | |
| SRP219564 | GOT1 | 2805 | RNAseq | -0.0774 | 0.8389 | |
| TCGA | GOT1 | 2805 | RNAseq | -0.2295 | 0.0000 |
Upregulated datasets: 1; Downregulated datasets: 1.
Survival by GOT1 expression:
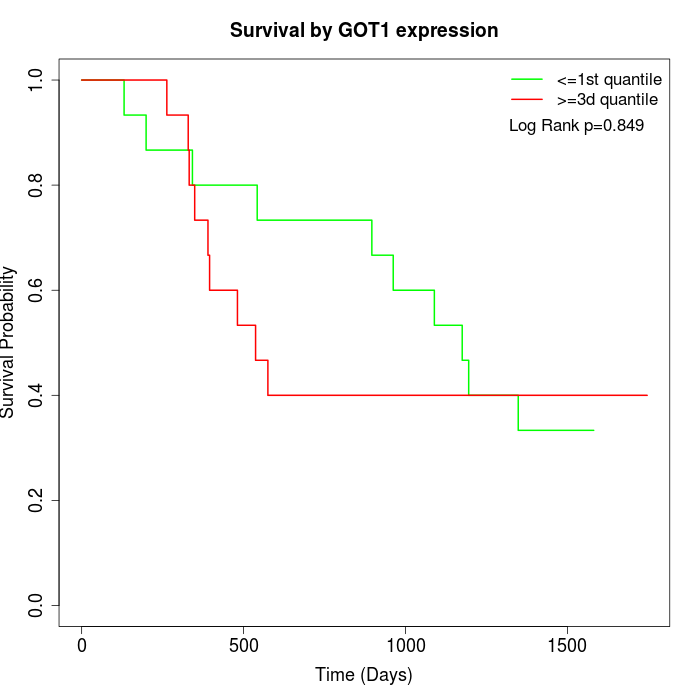 | 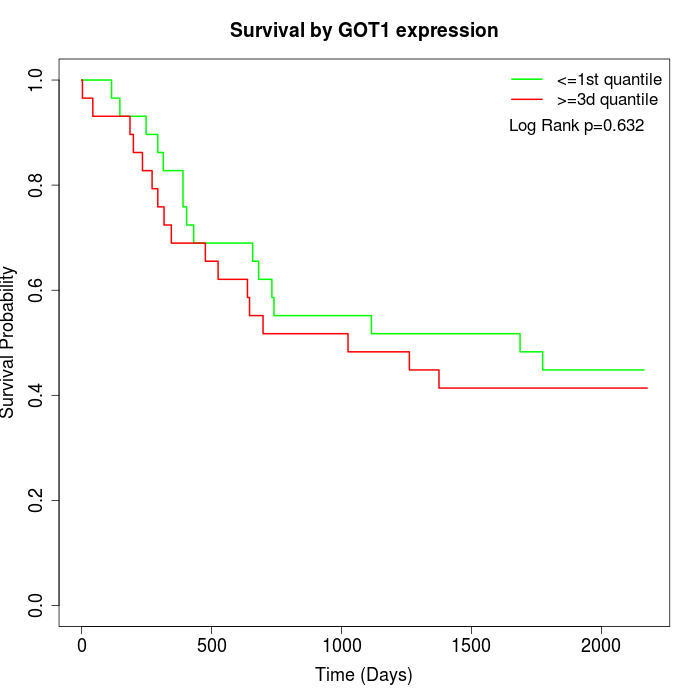 | 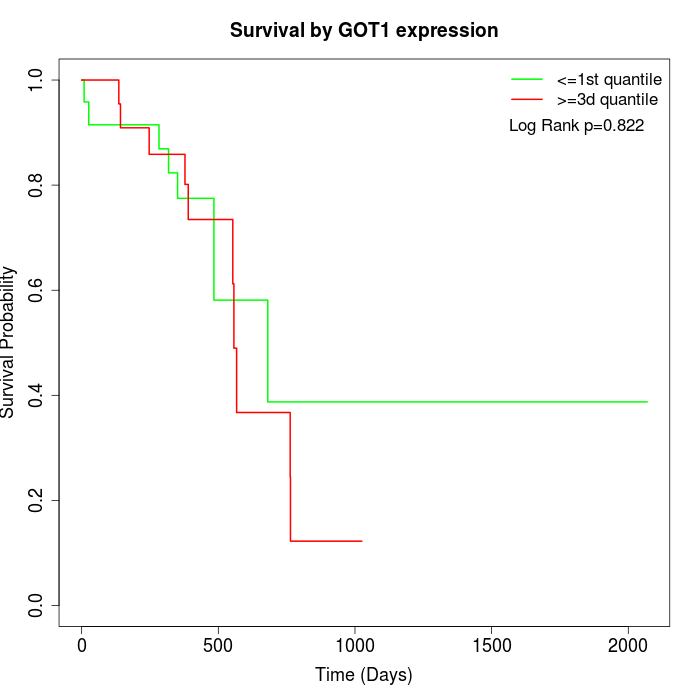 |
| GSE53622 | GSE53624 | TCGA |
Note: Click image to view full size file.
Copy number change of GOT1:
| Dataset | Gene | EntrezID | Gain | Loss | Normal | Detail |
|---|---|---|---|---|---|---|
| GSE15526 | GOT1 | 2805 | 1 | 8 | 21 | |
| GSE20123 | GOT1 | 2805 | 1 | 7 | 22 | |
| GSE43470 | GOT1 | 2805 | 0 | 7 | 36 | |
| GSE46452 | GOT1 | 2805 | 0 | 11 | 48 | |
| GSE47630 | GOT1 | 2805 | 2 | 14 | 24 | |
| GSE54993 | GOT1 | 2805 | 8 | 0 | 62 | |
| GSE54994 | GOT1 | 2805 | 1 | 12 | 40 | |
| GSE60625 | GOT1 | 2805 | 0 | 0 | 11 | |
| GSE74703 | GOT1 | 2805 | 0 | 5 | 31 | |
| GSE74704 | GOT1 | 2805 | 0 | 4 | 16 | |
| TCGA | GOT1 | 2805 | 5 | 28 | 63 |
Total number of gains: 18; Total number of losses: 96; Total Number of normals: 374.
Somatic mutations of GOT1:
Generating mutation plots.
Highly correlated genes for GOT1:
Showing top 20/605 corelated genes with mean PCC>0.5.
| Gene1 | Gene2 | Mean PCC | Num. Datasets | Num. PCC<0 | Num. PCC>0.5 |
|---|---|---|---|---|---|
| GOT1 | ZNF518A | 0.817767 | 3 | 0 | 3 |
| GOT1 | KAT5 | 0.777204 | 3 | 0 | 3 |
| GOT1 | RSL24D1 | 0.764454 | 3 | 0 | 3 |
| GOT1 | CCDC65 | 0.761644 | 3 | 0 | 3 |
| GOT1 | THAP2 | 0.761349 | 3 | 0 | 3 |
| GOT1 | UBE2NL | 0.751735 | 3 | 0 | 3 |
| GOT1 | CYCS | 0.748712 | 3 | 0 | 3 |
| GOT1 | PIK3C2A | 0.747713 | 3 | 0 | 3 |
| GOT1 | PITRM1 | 0.746896 | 3 | 0 | 3 |
| GOT1 | DEF8 | 0.740472 | 3 | 0 | 3 |
| GOT1 | SLC22A15 | 0.730012 | 3 | 0 | 3 |
| GOT1 | NRARP | 0.727093 | 3 | 0 | 3 |
| GOT1 | GOLGA4 | 0.726071 | 3 | 0 | 3 |
| GOT1 | ZCCHC8 | 0.720621 | 4 | 0 | 4 |
| GOT1 | CGRRF1 | 0.719634 | 3 | 0 | 3 |
| GOT1 | MRPL37 | 0.719517 | 4 | 0 | 4 |
| GOT1 | ZNF416 | 0.717257 | 3 | 0 | 3 |
| GOT1 | RNF207 | 0.711721 | 4 | 0 | 3 |
| GOT1 | MRPS11 | 0.707604 | 4 | 0 | 3 |
| GOT1 | TUNAR | 0.700425 | 3 | 0 | 3 |
For details and further investigation, click here