| Full name: enolase-phosphatase 1 | Alias Symbol: MASA|E1|mtnC | ||
| Type: protein-coding gene | Cytoband: 4q21.22 | ||
| Entrez ID: 58478 | HGNC ID: HGNC:24599 | Ensembl Gene: ENSG00000145293 | OMIM ID: |
| Drug and gene relationship at DGIdb | |||
Expression of ENOPH1:
| Dataset | Gene | EntrezID | Probe | Log2FC | Adj.pValue | Expression |
|---|---|---|---|---|---|---|
| GSE17351 | ENOPH1 | 58478 | 217956_s_at | 0.2632 | 0.4775 | |
| GSE20347 | ENOPH1 | 58478 | 217956_s_at | -0.0408 | 0.7315 | |
| GSE23400 | ENOPH1 | 58478 | 217956_s_at | 0.1975 | 0.0064 | |
| GSE26886 | ENOPH1 | 58478 | 217956_s_at | -0.1716 | 0.4825 | |
| GSE29001 | ENOPH1 | 58478 | 217956_s_at | 0.0374 | 0.9020 | |
| GSE38129 | ENOPH1 | 58478 | 217956_s_at | 0.1858 | 0.0794 | |
| GSE45670 | ENOPH1 | 58478 | 217956_s_at | -0.1541 | 0.1335 | |
| GSE53622 | ENOPH1 | 58478 | 56005 | 0.1988 | 0.0071 | |
| GSE53624 | ENOPH1 | 58478 | 56005 | 0.0560 | 0.4635 | |
| GSE63941 | ENOPH1 | 58478 | 217956_s_at | 0.4643 | 0.1444 | |
| GSE77861 | ENOPH1 | 58478 | 217956_s_at | -0.1248 | 0.6600 | |
| GSE97050 | ENOPH1 | 58478 | A_23_P121806 | 0.2775 | 0.5082 | |
| SRP007169 | ENOPH1 | 58478 | RNAseq | -0.1676 | 0.6576 | |
| SRP008496 | ENOPH1 | 58478 | RNAseq | -0.1883 | 0.4971 | |
| SRP064894 | ENOPH1 | 58478 | RNAseq | -0.2228 | 0.1735 | |
| SRP133303 | ENOPH1 | 58478 | RNAseq | 0.2773 | 0.1017 | |
| SRP159526 | ENOPH1 | 58478 | RNAseq | 0.0058 | 0.9733 | |
| SRP193095 | ENOPH1 | 58478 | RNAseq | -0.2138 | 0.0928 | |
| SRP219564 | ENOPH1 | 58478 | RNAseq | -0.0663 | 0.8263 | |
| TCGA | ENOPH1 | 58478 | RNAseq | 0.1391 | 0.0063 |
Upregulated datasets: 0; Downregulated datasets: 0.
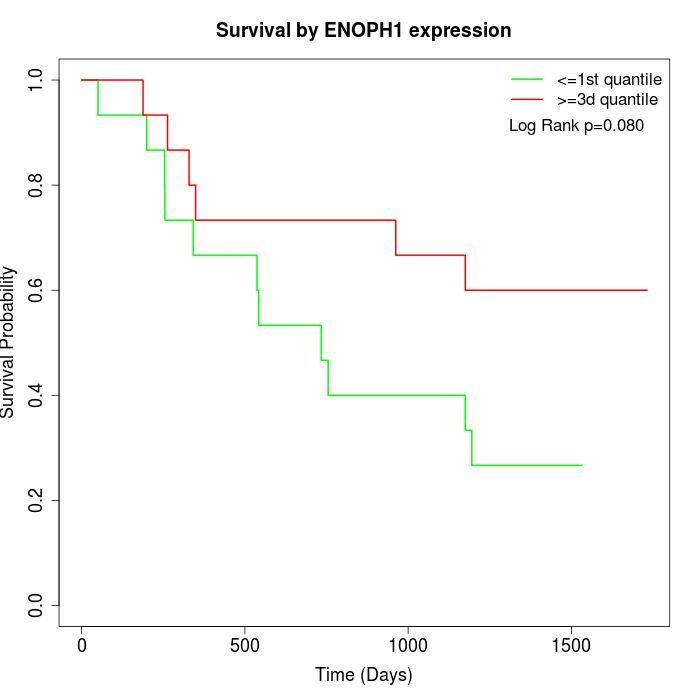
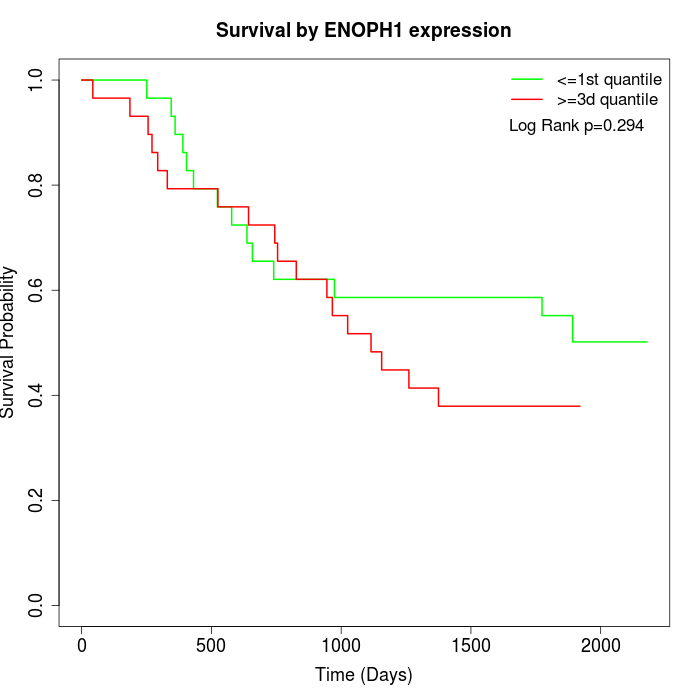
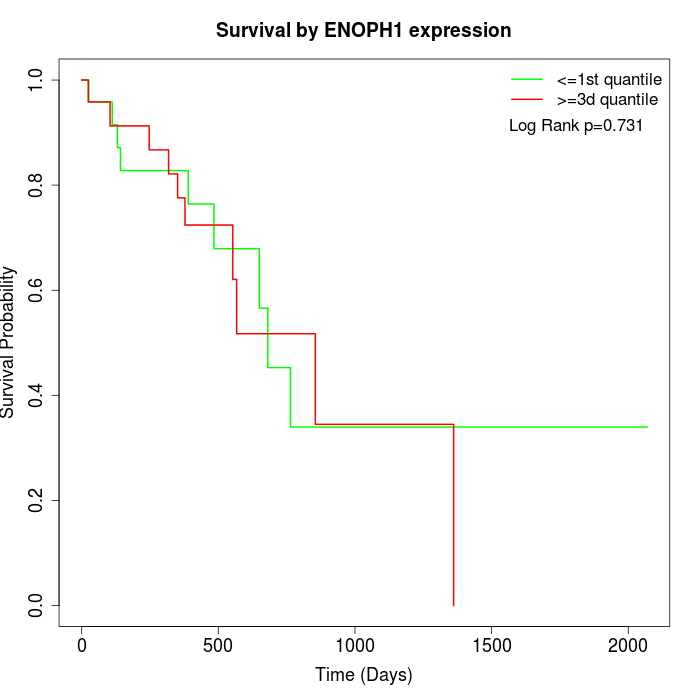
Survival by ENOPH1 expression:
Note: Click image to view full size file.
Copy number change of ENOPH1:
| Dataset | Gene | EntrezID | Gain | Loss | Normal | Detail |
|---|---|---|---|---|---|---|
| GSE15526 | ENOPH1 | 58478 | 2 | 11 | 17 | |
| GSE20123 | ENOPH1 | 58478 | 2 | 11 | 17 | |
| GSE43470 | ENOPH1 | 58478 | 0 | 13 | 30 | |
| GSE46452 | ENOPH1 | 58478 | 1 | 36 | 22 | |
| GSE47630 | ENOPH1 | 58478 | 0 | 20 | 20 | |
| GSE54993 | ENOPH1 | 58478 | 8 | 0 | 62 | |
| GSE54994 | ENOPH1 | 58478 | 1 | 9 | 43 | |
| GSE60625 | ENOPH1 | 58478 | 0 | 0 | 11 | |
| GSE74703 | ENOPH1 | 58478 | 0 | 11 | 25 | |
| GSE74704 | ENOPH1 | 58478 | 1 | 6 | 13 | |
| TCGA | ENOPH1 | 58478 | 12 | 34 | 50 |
Total number of gains: 27; Total number of losses: 151; Total Number of normals: 310.
Somatic mutations of ENOPH1:
Generating mutation plots.
Highly correlated genes for ENOPH1:
Showing top 20/425 corelated genes with mean PCC>0.5.
| Gene1 | Gene2 | Mean PCC | Num. Datasets | Num. PCC<0 | Num. PCC>0.5 |
|---|---|---|---|---|---|
| ENOPH1 | PRKCH | 0.731487 | 3 | 0 | 3 |
| ENOPH1 | DDX21 | 0.715999 | 3 | 0 | 3 |
| ENOPH1 | SLC25A43 | 0.701051 | 3 | 0 | 3 |
| ENOPH1 | INTS10 | 0.700234 | 5 | 0 | 5 |
| ENOPH1 | MPHOSPH9 | 0.69992 | 4 | 0 | 4 |
| ENOPH1 | CLOCK | 0.697171 | 4 | 0 | 4 |
| ENOPH1 | RPUSD4 | 0.696769 | 3 | 0 | 3 |
| ENOPH1 | RPL19 | 0.695736 | 3 | 0 | 3 |
| ENOPH1 | SCO1 | 0.694625 | 4 | 0 | 4 |
| ENOPH1 | ZNF485 | 0.68664 | 3 | 0 | 3 |
| ENOPH1 | ZBTB44 | 0.6852 | 3 | 0 | 3 |
| ENOPH1 | MIS18BP1 | 0.67981 | 3 | 0 | 3 |
| ENOPH1 | LARP7 | 0.679643 | 6 | 0 | 6 |
| ENOPH1 | RPP38 | 0.679051 | 4 | 0 | 3 |
| ENOPH1 | ECD | 0.679047 | 3 | 0 | 3 |
| ENOPH1 | NFXL1 | 0.675388 | 5 | 0 | 5 |
| ENOPH1 | KDM2B | 0.673346 | 4 | 0 | 3 |
| ENOPH1 | TYW5 | 0.672678 | 3 | 0 | 3 |
| ENOPH1 | TRMT6 | 0.669958 | 4 | 0 | 3 |
| ENOPH1 | HAUS1 | 0.669507 | 3 | 0 | 3 |
For details and further investigation, click here


