| Full name: integrator complex subunit 10 | Alias Symbol: FLJ10569|INT10 | ||
| Type: protein-coding gene | Cytoband: 8p21.3 | ||
| Entrez ID: 55174 | HGNC ID: HGNC:25548 | Ensembl Gene: ENSG00000104613 | OMIM ID: 611353 |
Screen Evidence:
| |||
Expression of INTS10:
| Dataset | Gene | EntrezID | Probe | Log2FC | Adj.pValue | Expression |
|---|---|---|---|---|---|---|
| GSE17351 | INTS10 | 55174 | 229632_s_at | 0.1986 | 0.3526 | |
| GSE26886 | INTS10 | 55174 | 229632_s_at | -0.0779 | 0.6821 | |
| GSE45670 | INTS10 | 55174 | 229632_s_at | 0.0409 | 0.8281 | |
| GSE53622 | INTS10 | 55174 | 39083 | -0.0250 | 0.7711 | |
| GSE53624 | INTS10 | 55174 | 39083 | -0.0301 | 0.6428 | |
| GSE63941 | INTS10 | 55174 | 229632_s_at | -0.4975 | 0.3149 | |
| GSE77861 | INTS10 | 55174 | 229632_s_at | 0.5188 | 0.2827 | |
| GSE97050 | INTS10 | 55174 | A_23_P157607 | 0.1749 | 0.3631 | |
| SRP007169 | INTS10 | 55174 | RNAseq | 0.8169 | 0.0652 | |
| SRP008496 | INTS10 | 55174 | RNAseq | 0.5670 | 0.0398 | |
| SRP064894 | INTS10 | 55174 | RNAseq | 0.0697 | 0.6591 | |
| SRP133303 | INTS10 | 55174 | RNAseq | -0.3283 | 0.0671 | |
| SRP159526 | INTS10 | 55174 | RNAseq | -0.0368 | 0.8590 | |
| SRP193095 | INTS10 | 55174 | RNAseq | -0.2081 | 0.0568 | |
| SRP219564 | INTS10 | 55174 | RNAseq | -0.2707 | 0.4643 | |
| TCGA | INTS10 | 55174 | RNAseq | -0.0248 | 0.6247 |
Upregulated datasets: 0; Downregulated datasets: 0.
Survival by INTS10 expression:
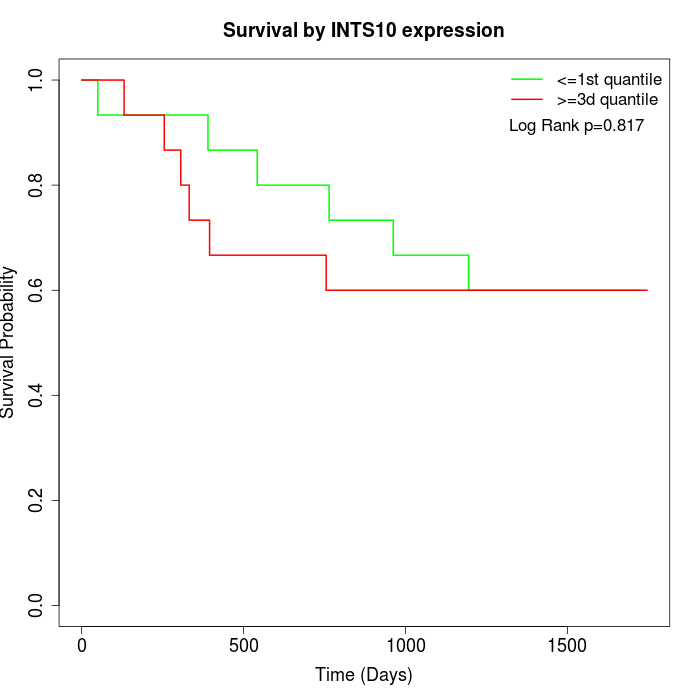 | 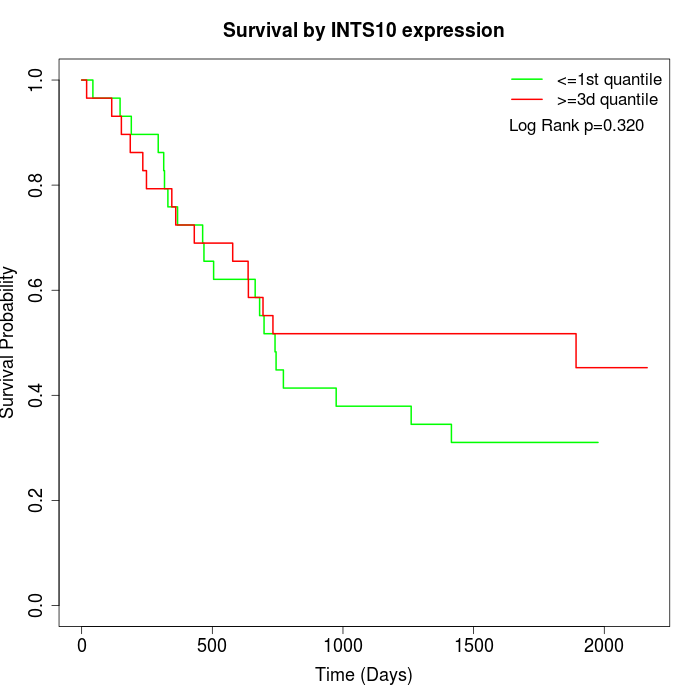 | 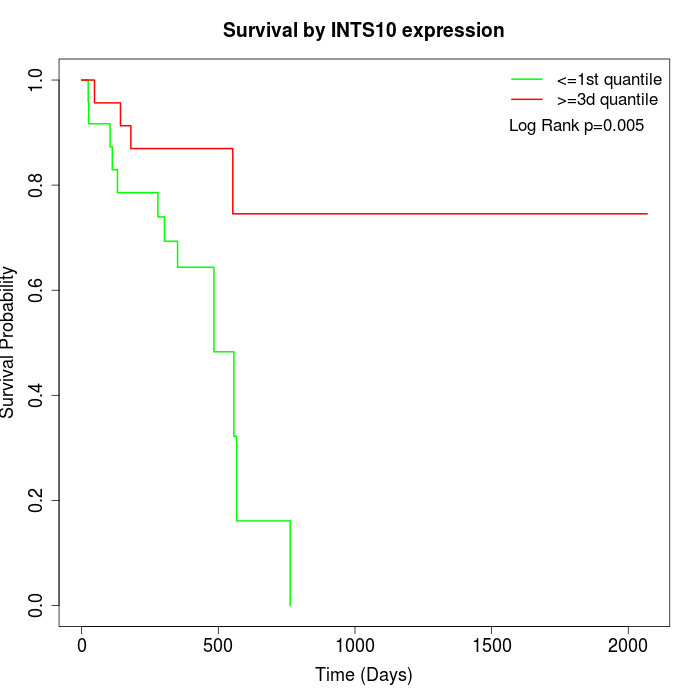 |
| GSE53622 | GSE53624 | TCGA |
Note: Click image to view full size file.
Copy number change of INTS10:
| Dataset | Gene | EntrezID | Gain | Loss | Normal | Detail |
|---|---|---|---|---|---|---|
| GSE15526 | INTS10 | 55174 | 4 | 10 | 16 | |
| GSE20123 | INTS10 | 55174 | 4 | 10 | 16 | |
| GSE43470 | INTS10 | 55174 | 4 | 8 | 31 | |
| GSE46452 | INTS10 | 55174 | 14 | 13 | 32 | |
| GSE47630 | INTS10 | 55174 | 10 | 8 | 22 | |
| GSE54993 | INTS10 | 55174 | 2 | 14 | 54 | |
| GSE54994 | INTS10 | 55174 | 8 | 18 | 27 | |
| GSE60625 | INTS10 | 55174 | 3 | 0 | 8 | |
| GSE74703 | INTS10 | 55174 | 4 | 7 | 25 | |
| GSE74704 | INTS10 | 55174 | 3 | 6 | 11 | |
| TCGA | INTS10 | 55174 | 14 | 42 | 40 |
Total number of gains: 70; Total number of losses: 136; Total Number of normals: 282.
Somatic mutations of INTS10:
Generating mutation plots.
Highly correlated genes for INTS10:
Showing top 20/461 corelated genes with mean PCC>0.5.
| Gene1 | Gene2 | Mean PCC | Num. Datasets | Num. PCC<0 | Num. PCC>0.5 |
|---|---|---|---|---|---|
| INTS10 | MAD2L2 | 0.865357 | 3 | 0 | 3 |
| INTS10 | ZDHHC16 | 0.820221 | 3 | 0 | 3 |
| INTS10 | MRPL11 | 0.809993 | 3 | 0 | 3 |
| INTS10 | CCT2 | 0.80061 | 3 | 0 | 3 |
| INTS10 | CWF19L1 | 0.794722 | 3 | 0 | 3 |
| INTS10 | ADAM10 | 0.79347 | 3 | 0 | 3 |
| INTS10 | FRS2 | 0.787634 | 3 | 0 | 3 |
| INTS10 | MIS18A | 0.782407 | 3 | 0 | 3 |
| INTS10 | MRPL36 | 0.781737 | 3 | 0 | 3 |
| INTS10 | DEPDC1 | 0.778178 | 3 | 0 | 3 |
| INTS10 | POLR2J | 0.778081 | 3 | 0 | 3 |
| INTS10 | PSTPIP2 | 0.777911 | 3 | 0 | 3 |
| INTS10 | MCM10 | 0.772926 | 3 | 0 | 3 |
| INTS10 | SPRED1 | 0.772763 | 3 | 0 | 3 |
| INTS10 | SSRP1 | 0.771641 | 3 | 0 | 3 |
| INTS10 | MINPP1 | 0.765965 | 3 | 0 | 3 |
| INTS10 | YIF1A | 0.762912 | 3 | 0 | 3 |
| INTS10 | CPNE8 | 0.760476 | 3 | 0 | 3 |
| INTS10 | ACP1 | 0.758778 | 3 | 0 | 3 |
| INTS10 | RCC1 | 0.758521 | 3 | 0 | 3 |
For details and further investigation, click here