| Full name: EPH receptor A10 | Alias Symbol: FLJ16103|FLJ33655 | ||
| Type: protein-coding gene | Cytoband: 1p34.3 | ||
| Entrez ID: 284656 | HGNC ID: HGNC:19987 | Ensembl Gene: ENSG00000183317 | OMIM ID: 611123 |
| Related drugs: VANDETANIB... [more] | |||
Expression of EPHA10:
| Dataset | Gene | EntrezID | Probe | Log2FC | Adj.pValue | Expression |
|---|---|---|---|---|---|---|
| GSE17351 | EPHA10 | 284656 | 236073_at | -0.0522 | 0.8835 | |
| GSE26886 | EPHA10 | 284656 | 236073_at | 0.0922 | 0.5746 | |
| GSE45670 | EPHA10 | 284656 | 236073_at | -0.0726 | 0.5102 | |
| GSE53622 | EPHA10 | 284656 | 41823 | -0.0143 | 0.8518 | |
| GSE53624 | EPHA10 | 284656 | 41823 | 0.0144 | 0.8931 | |
| GSE63941 | EPHA10 | 284656 | 236073_at | 0.4684 | 0.0292 | |
| GSE77861 | EPHA10 | 284656 | 236073_at | -0.1358 | 0.3524 | |
| GSE97050 | EPHA10 | 284656 | A_33_P3301104 | -1.5212 | 0.1978 | |
| SRP064894 | EPHA10 | 284656 | RNAseq | -0.2488 | 0.5637 | |
| SRP133303 | EPHA10 | 284656 | RNAseq | -0.1329 | 0.6478 | |
| SRP159526 | EPHA10 | 284656 | RNAseq | -0.8516 | 0.4129 | |
| SRP219564 | EPHA10 | 284656 | RNAseq | 1.4205 | 0.1461 | |
| TCGA | EPHA10 | 284656 | RNAseq | -1.2169 | 0.0159 |
Upregulated datasets: 0; Downregulated datasets: 1.
Survival by EPHA10 expression:
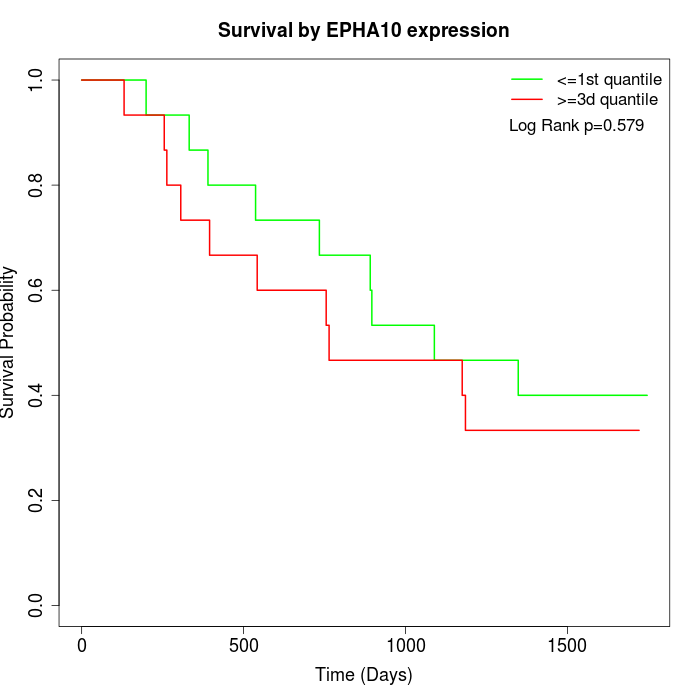 | 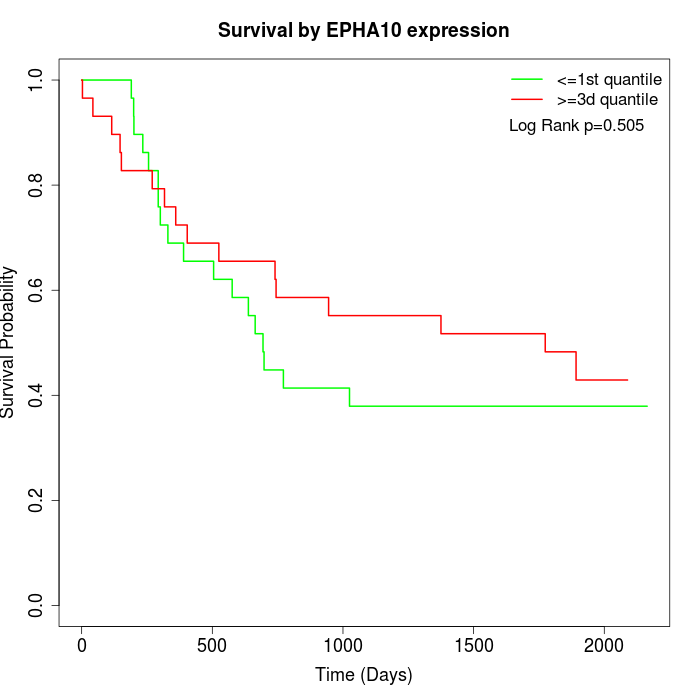 | 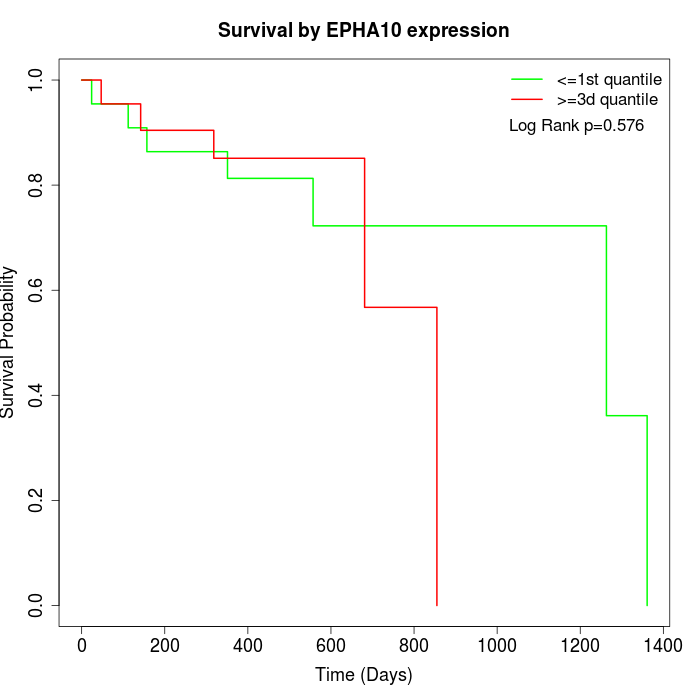 |
| GSE53622 | GSE53624 | TCGA |
Note: Click image to view full size file.
Copy number change of EPHA10:
| Dataset | Gene | EntrezID | Gain | Loss | Normal | Detail |
|---|---|---|---|---|---|---|
| GSE15526 | EPHA10 | 284656 | 2 | 4 | 24 | |
| GSE20123 | EPHA10 | 284656 | 2 | 3 | 25 | |
| GSE43470 | EPHA10 | 284656 | 7 | 3 | 33 | |
| GSE46452 | EPHA10 | 284656 | 4 | 1 | 54 | |
| GSE47630 | EPHA10 | 284656 | 8 | 3 | 29 | |
| GSE54993 | EPHA10 | 284656 | 1 | 1 | 68 | |
| GSE54994 | EPHA10 | 284656 | 12 | 2 | 39 | |
| GSE60625 | EPHA10 | 284656 | 0 | 0 | 11 | |
| GSE74703 | EPHA10 | 284656 | 6 | 2 | 28 | |
| GSE74704 | EPHA10 | 284656 | 1 | 0 | 19 | |
| TCGA | EPHA10 | 284656 | 12 | 16 | 68 |
Total number of gains: 55; Total number of losses: 35; Total Number of normals: 398.
Somatic mutations of EPHA10:
Generating mutation plots.
Highly correlated genes for EPHA10:
Showing top 20/266 corelated genes with mean PCC>0.5.
| Gene1 | Gene2 | Mean PCC | Num. Datasets | Num. PCC<0 | Num. PCC>0.5 |
|---|---|---|---|---|---|
| EPHA10 | OR7G2 | 0.790125 | 3 | 0 | 3 |
| EPHA10 | OR2B11 | 0.780925 | 3 | 0 | 3 |
| EPHA10 | OR2T4 | 0.780882 | 3 | 0 | 3 |
| EPHA10 | PRSS38 | 0.763282 | 3 | 0 | 3 |
| EPHA10 | OTOG | 0.755229 | 3 | 0 | 3 |
| EPHA10 | OR2G2 | 0.750326 | 3 | 0 | 3 |
| EPHA10 | DYTN | 0.747416 | 3 | 0 | 3 |
| EPHA10 | HOXB5 | 0.737685 | 3 | 0 | 3 |
| EPHA10 | OPRD1 | 0.730414 | 4 | 0 | 4 |
| EPHA10 | MIXL1 | 0.728379 | 3 | 0 | 3 |
| EPHA10 | SLC34A1 | 0.726913 | 5 | 0 | 5 |
| EPHA10 | OR4C3 | 0.726148 | 3 | 0 | 3 |
| EPHA10 | AOC2 | 0.720562 | 3 | 0 | 3 |
| EPHA10 | NCR3 | 0.719176 | 3 | 0 | 3 |
| EPHA10 | SLC25A47 | 0.719106 | 5 | 0 | 5 |
| EPHA10 | MRGPRD | 0.715594 | 3 | 0 | 3 |
| EPHA10 | SPACA5 | 0.714242 | 3 | 0 | 3 |
| EPHA10 | LYZL2 | 0.710296 | 3 | 0 | 3 |
| EPHA10 | OR2T1 | 0.709264 | 3 | 0 | 3 |
| EPHA10 | TBX21 | 0.703118 | 4 | 0 | 3 |
For details and further investigation, click here