| Full name: erythropoietin | Alias Symbol: EP | ||
| Type: protein-coding gene | Cytoband: 7q22.1 | ||
| Entrez ID: 2056 | HGNC ID: HGNC:3415 | Ensembl Gene: ENSG00000130427 | OMIM ID: 133170 |
| Related drugs: ARSENIC TRIOXIDE, CETUXIMAB, GONADOTROPIN, CHORIONIC, MYCOPHENOLATE MOFETIL, OXYMETHOLONE... [more] | |||
EPO involved pathways:
| KEGG pathway | Description | View |
|---|---|---|
| hsa04066 | HIF-1 signaling pathway | |
| hsa04151 | PI3K-Akt signaling pathway | |
| hsa04630 | Jak-STAT signaling pathway |
Expression of EPO:
| Dataset | Gene | EntrezID | Probe | Log2FC | Adj.pValue | Expression |
|---|---|---|---|---|---|---|
| GSE17351 | EPO | 2056 | 217254_s_at | -0.2680 | 0.3149 | |
| GSE20347 | EPO | 2056 | 217254_s_at | -0.0258 | 0.7183 | |
| GSE23400 | EPO | 2056 | 217254_s_at | -0.0889 | 0.0129 | |
| GSE26886 | EPO | 2056 | 217254_s_at | 0.2106 | 0.1175 | |
| GSE29001 | EPO | 2056 | 217254_s_at | -0.1794 | 0.4116 | |
| GSE38129 | EPO | 2056 | 217254_s_at | -0.0521 | 0.6337 | |
| GSE45670 | EPO | 2056 | 217254_s_at | -0.1049 | 0.3222 | |
| GSE53622 | EPO | 2056 | 157013 | 0.0925 | 0.5536 | |
| GSE53624 | EPO | 2056 | 157013 | 0.0516 | 0.6433 | |
| GSE63941 | EPO | 2056 | 217254_s_at | 0.3484 | 0.0248 | |
| GSE77861 | EPO | 2056 | 207257_at | -0.2390 | 0.0539 | |
| TCGA | EPO | 2056 | RNAseq | 3.0038 | 0.0000 |
Upregulated datasets: 1; Downregulated datasets: 0.
Survival by EPO expression:
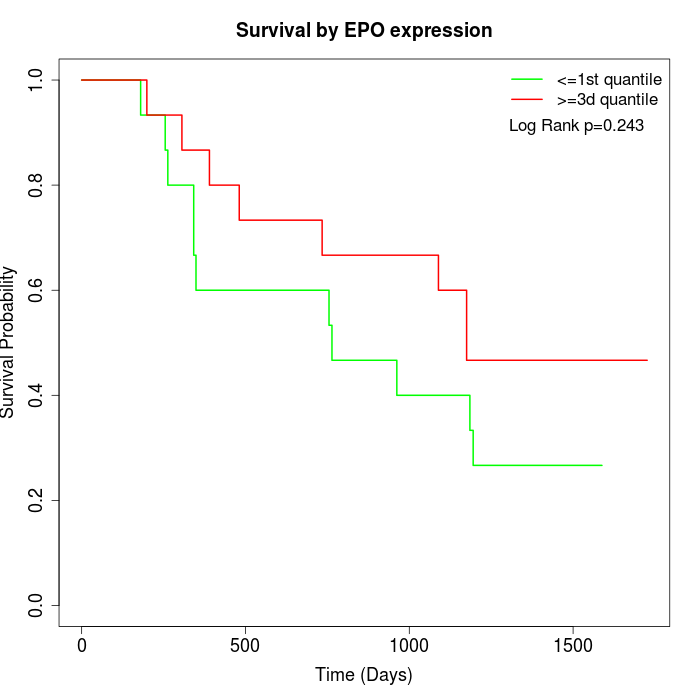 | 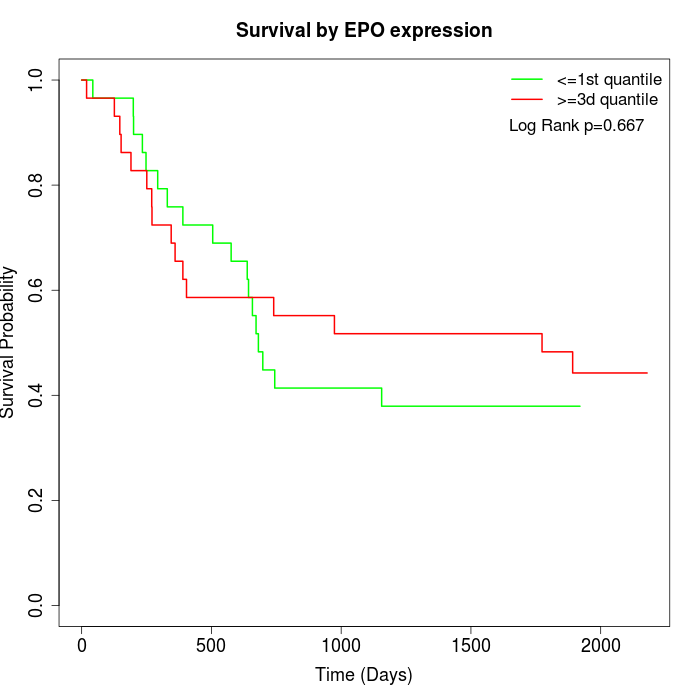 | 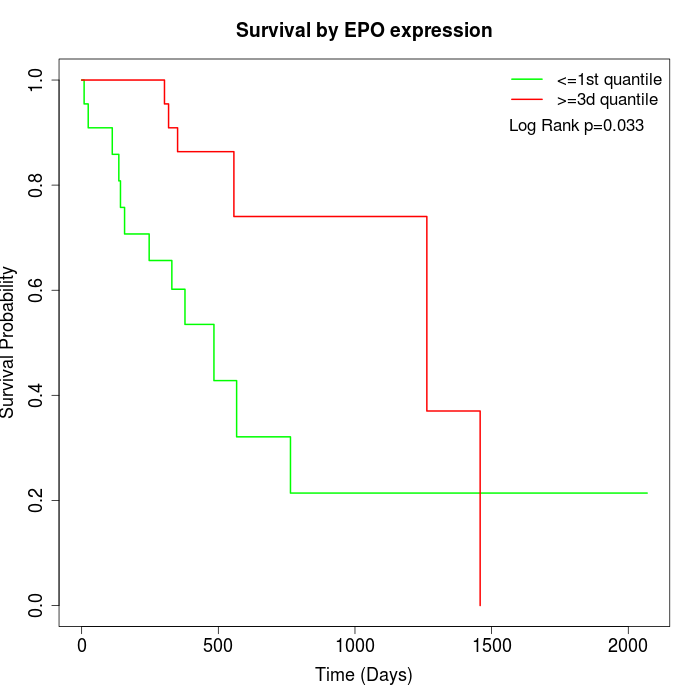 |
| GSE53622 | GSE53624 | TCGA |
Note: Click image to view full size file.
Copy number change of EPO:
| Dataset | Gene | EntrezID | Gain | Loss | Normal | Detail |
|---|---|---|---|---|---|---|
| GSE15526 | EPO | 2056 | 13 | 0 | 17 | |
| GSE20123 | EPO | 2056 | 13 | 0 | 17 | |
| GSE43470 | EPO | 2056 | 7 | 2 | 34 | |
| GSE46452 | EPO | 2056 | 11 | 1 | 47 | |
| GSE47630 | EPO | 2056 | 7 | 3 | 30 | |
| GSE54993 | EPO | 2056 | 1 | 9 | 60 | |
| GSE54994 | EPO | 2056 | 16 | 3 | 34 | |
| GSE60625 | EPO | 2056 | 0 | 0 | 11 | |
| GSE74703 | EPO | 2056 | 7 | 1 | 28 | |
| GSE74704 | EPO | 2056 | 9 | 0 | 11 | |
| TCGA | EPO | 2056 | 53 | 6 | 37 |
Total number of gains: 137; Total number of losses: 25; Total Number of normals: 326.
Somatic mutations of EPO:
Generating mutation plots.
Highly correlated genes for EPO:
Showing top 20/708 corelated genes with mean PCC>0.5.
| Gene1 | Gene2 | Mean PCC | Num. Datasets | Num. PCC<0 | Num. PCC>0.5 |
|---|---|---|---|---|---|
| EPO | TCL6 | 0.777433 | 3 | 0 | 3 |
| EPO | PCBP4 | 0.725735 | 3 | 0 | 3 |
| EPO | CHST8 | 0.725251 | 5 | 0 | 5 |
| EPO | OCM2 | 0.700419 | 4 | 0 | 4 |
| EPO | C3orf36 | 0.696298 | 4 | 0 | 4 |
| EPO | SREBF2 | 0.695927 | 3 | 0 | 3 |
| EPO | SPIN2A | 0.692316 | 4 | 0 | 4 |
| EPO | RORC | 0.691762 | 4 | 0 | 4 |
| EPO | RASGRP2 | 0.686962 | 3 | 0 | 3 |
| EPO | NR2E3 | 0.684407 | 5 | 0 | 4 |
| EPO | REXO1 | 0.68425 | 4 | 0 | 3 |
| EPO | GLP1R | 0.680547 | 4 | 0 | 3 |
| EPO | ZNF214 | 0.675477 | 4 | 0 | 4 |
| EPO | FOXN4 | 0.67427 | 3 | 0 | 3 |
| EPO | GRIN2B | 0.674095 | 4 | 0 | 4 |
| EPO | DPEP3 | 0.672874 | 3 | 0 | 3 |
| EPO | TAS2R1 | 0.67085 | 4 | 0 | 3 |
| EPO | CCL24 | 0.669685 | 4 | 0 | 4 |
| EPO | ADCYAP1R1 | 0.668613 | 5 | 0 | 4 |
| EPO | HCN4 | 0.667827 | 3 | 0 | 3 |
For details and further investigation, click here