| Full name: coagulation factor III, tissue factor | Alias Symbol: CD142|TF | ||
| Type: protein-coding gene | Cytoband: 1p21.3 | ||
| Entrez ID: 2152 | HGNC ID: HGNC:3541 | Ensembl Gene: ENSG00000117525 | OMIM ID: 134390 |
F3 involved pathways:
| KEGG pathway | Description | View |
|---|---|---|
| hsa04610 | Complement and coagulation cascades | |
| hsa04933 | AGE-RAGE signaling pathway in diabetic complications |
Expression of F3:
| Dataset | Gene | EntrezID | Probe | Log2FC | Adj.pValue | Expression |
|---|---|---|---|---|---|---|
| GSE17351 | F3 | 2152 | 204363_at | -0.2041 | 0.8917 | |
| GSE20347 | F3 | 2152 | 204363_at | 0.2998 | 0.5480 | |
| GSE23400 | F3 | 2152 | 204363_at | 0.6664 | 0.0011 | |
| GSE26886 | F3 | 2152 | 204363_at | 0.1470 | 0.8467 | |
| GSE29001 | F3 | 2152 | 204363_at | 0.2365 | 0.7514 | |
| GSE38129 | F3 | 2152 | 204363_at | 0.2562 | 0.5446 | |
| GSE45670 | F3 | 2152 | 204363_at | 0.5406 | 0.3437 | |
| GSE53622 | F3 | 2152 | 408 | 0.0856 | 0.6847 | |
| GSE53624 | F3 | 2152 | 32778 | -0.0064 | 0.9677 | |
| GSE63941 | F3 | 2152 | 204363_at | -2.3292 | 0.0659 | |
| GSE77861 | F3 | 2152 | 204363_at | 0.4086 | 0.5554 | |
| GSE97050 | F3 | 2152 | A_33_P3226832 | 1.2778 | 0.2423 | |
| SRP007169 | F3 | 2152 | RNAseq | 1.9151 | 0.0306 | |
| SRP008496 | F3 | 2152 | RNAseq | -0.4024 | 0.1792 | |
| SRP064894 | F3 | 2152 | RNAseq | 0.6804 | 0.1236 | |
| SRP133303 | F3 | 2152 | RNAseq | 0.6292 | 0.1134 | |
| SRP159526 | F3 | 2152 | RNAseq | 0.2123 | 0.6330 | |
| SRP193095 | F3 | 2152 | RNAseq | 1.3022 | 0.0006 | |
| SRP219564 | F3 | 2152 | RNAseq | 0.7915 | 0.1401 | |
| TCGA | F3 | 2152 | RNAseq | -0.0342 | 0.8107 |
Upregulated datasets: 2; Downregulated datasets: 0.
Survival by F3 expression:
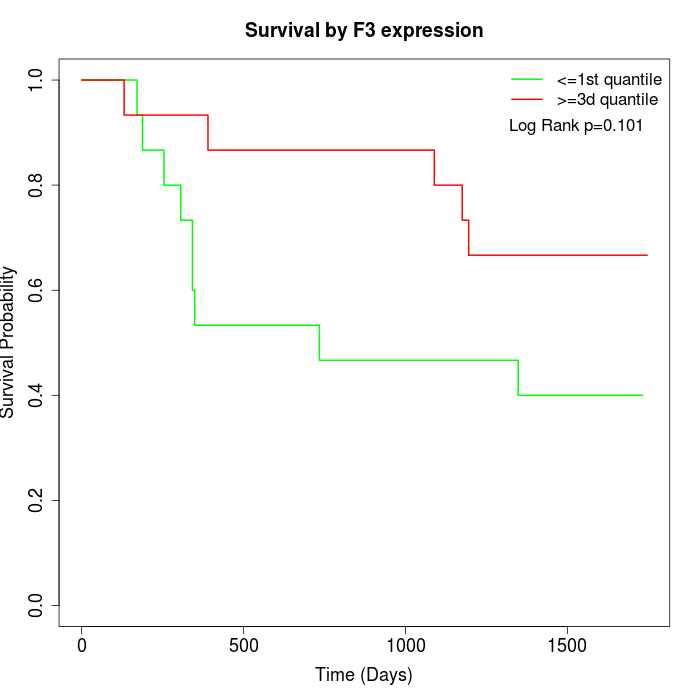 | 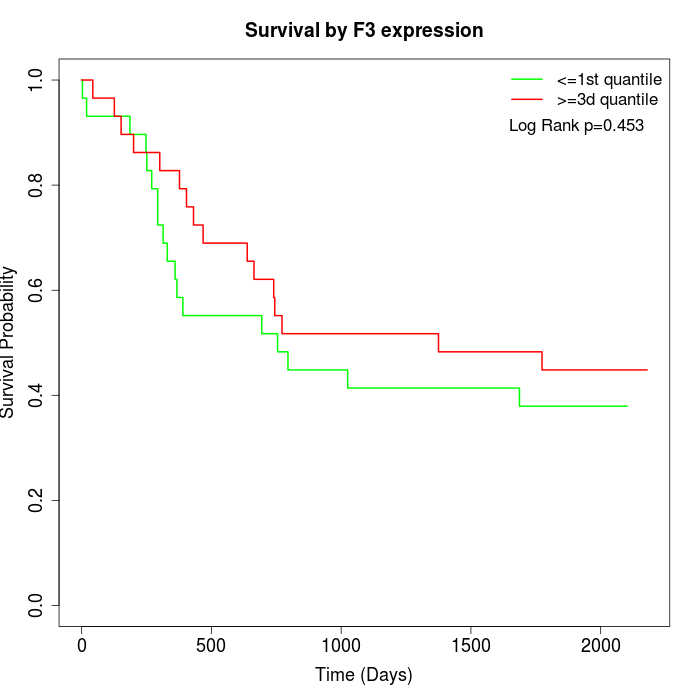 | 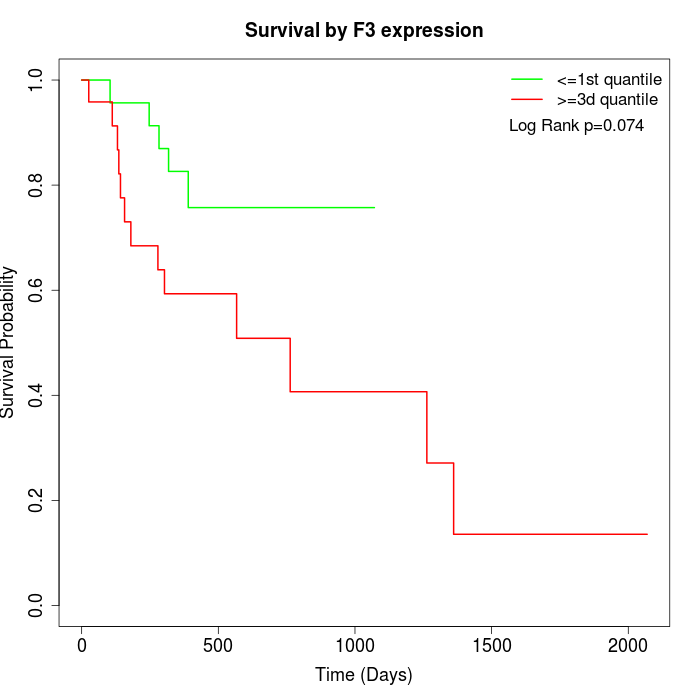 |
| GSE53622 | GSE53624 | TCGA |
Note: Click image to view full size file.
Copy number change of F3:
| Dataset | Gene | EntrezID | Gain | Loss | Normal | Detail |
|---|---|---|---|---|---|---|
| GSE15526 | F3 | 2152 | 0 | 8 | 22 | |
| GSE20123 | F3 | 2152 | 0 | 8 | 22 | |
| GSE43470 | F3 | 2152 | 2 | 6 | 35 | |
| GSE46452 | F3 | 2152 | 1 | 1 | 57 | |
| GSE47630 | F3 | 2152 | 8 | 5 | 27 | |
| GSE54993 | F3 | 2152 | 0 | 1 | 69 | |
| GSE54994 | F3 | 2152 | 6 | 3 | 44 | |
| GSE60625 | F3 | 2152 | 0 | 0 | 11 | |
| GSE74703 | F3 | 2152 | 1 | 5 | 30 | |
| GSE74704 | F3 | 2152 | 0 | 5 | 15 | |
| TCGA | F3 | 2152 | 6 | 24 | 66 |
Total number of gains: 24; Total number of losses: 66; Total Number of normals: 398.
Somatic mutations of F3:
Generating mutation plots.
Highly correlated genes for F3:
Showing top 20/70 corelated genes with mean PCC>0.5.
| Gene1 | Gene2 | Mean PCC | Num. Datasets | Num. PCC<0 | Num. PCC>0.5 |
|---|---|---|---|---|---|
| F3 | USP45 | 0.688382 | 3 | 0 | 3 |
| F3 | UBXN2A | 0.680137 | 3 | 0 | 3 |
| F3 | DEPDC7 | 0.670486 | 4 | 0 | 3 |
| F3 | PLA2G4A | 0.657595 | 3 | 0 | 3 |
| F3 | STAMBP | 0.655992 | 3 | 0 | 3 |
| F3 | IL1R1 | 0.653796 | 4 | 0 | 3 |
| F3 | HPS5 | 0.639416 | 4 | 0 | 3 |
| F3 | ZBED6 | 0.637656 | 3 | 0 | 3 |
| F3 | C9orf64 | 0.627681 | 3 | 0 | 3 |
| F3 | FST | 0.620335 | 5 | 0 | 3 |
| F3 | CREB5 | 0.615391 | 3 | 0 | 3 |
| F3 | CD44 | 0.613262 | 3 | 0 | 3 |
| F3 | FAM210A | 0.610283 | 3 | 0 | 3 |
| F3 | ASCC3 | 0.597569 | 5 | 0 | 3 |
| F3 | VEZT | 0.593085 | 4 | 0 | 4 |
| F3 | ZNF721 | 0.590141 | 3 | 0 | 3 |
| F3 | SNX13 | 0.583429 | 3 | 0 | 3 |
| F3 | RAP2C | 0.582509 | 4 | 0 | 3 |
| F3 | CHN1 | 0.582326 | 3 | 0 | 3 |
| F3 | SLC35E1 | 0.581555 | 3 | 0 | 3 |
For details and further investigation, click here