| Full name: DEP domain containing 7 | Alias Symbol: | ||
| Type: protein-coding gene | Cytoband: 11p13 | ||
| Entrez ID: 91614 | HGNC ID: HGNC:29899 | Ensembl Gene: ENSG00000121690 | OMIM ID: 612294 |
Expression of DEPDC7:
| Dataset | Gene | EntrezID | Probe | Log2FC | Adj.pValue | Expression |
|---|---|---|---|---|---|---|
| GSE17351 | DEPDC7 | 91614 | 228293_at | 0.0514 | 0.9776 | |
| GSE26886 | DEPDC7 | 91614 | 228293_at | 0.9365 | 0.0502 | |
| GSE45670 | DEPDC7 | 91614 | 228293_at | 0.2729 | 0.4419 | |
| GSE53622 | DEPDC7 | 91614 | 32521 | 0.0618 | 0.7351 | |
| GSE53624 | DEPDC7 | 91614 | 32521 | 0.1435 | 0.1958 | |
| GSE63941 | DEPDC7 | 91614 | 228293_at | -2.0074 | 0.1032 | |
| GSE77861 | DEPDC7 | 91614 | 228293_at | -0.3458 | 0.3780 | |
| GSE97050 | DEPDC7 | 91614 | A_23_P385126 | 0.5047 | 0.4458 | |
| SRP007169 | DEPDC7 | 91614 | RNAseq | -0.7570 | 0.2721 | |
| SRP064894 | DEPDC7 | 91614 | RNAseq | 0.1541 | 0.6054 | |
| SRP133303 | DEPDC7 | 91614 | RNAseq | 0.1145 | 0.7644 | |
| SRP159526 | DEPDC7 | 91614 | RNAseq | -0.6218 | 0.3487 | |
| SRP193095 | DEPDC7 | 91614 | RNAseq | -0.4346 | 0.0367 | |
| SRP219564 | DEPDC7 | 91614 | RNAseq | -0.4980 | 0.2392 | |
| TCGA | DEPDC7 | 91614 | RNAseq | 0.6046 | 0.0000 |
Upregulated datasets: 0; Downregulated datasets: 0.
Survival by DEPDC7 expression:
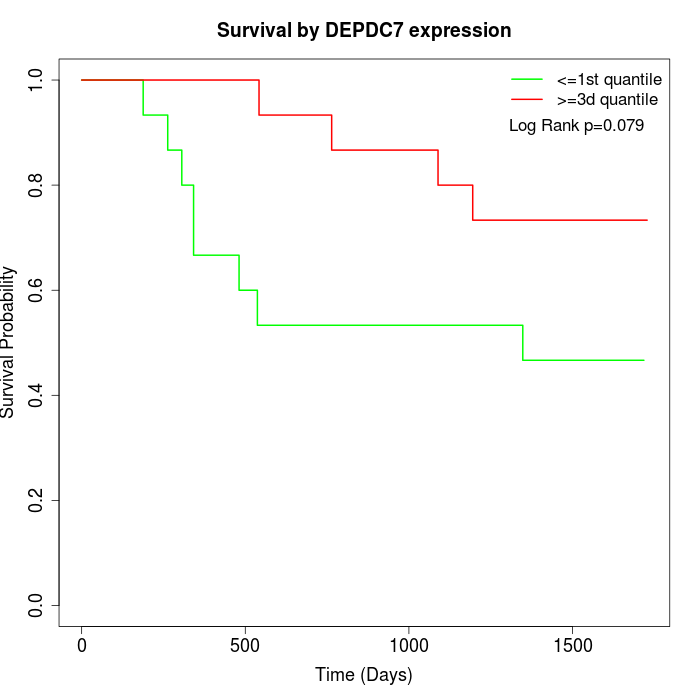 | 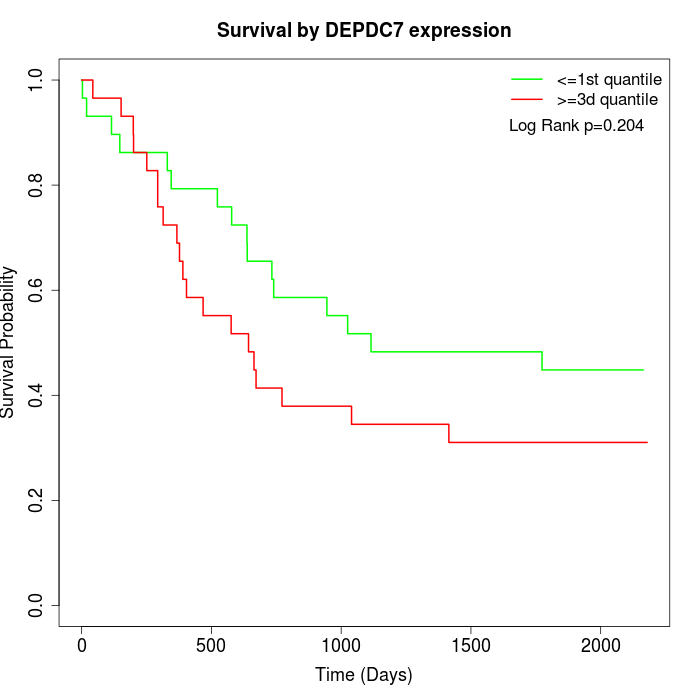 | 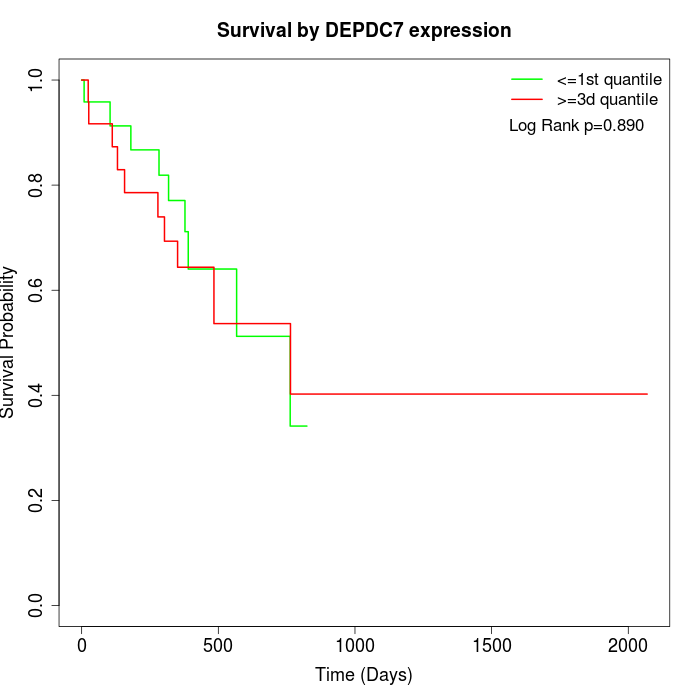 |
| GSE53622 | GSE53624 | TCGA |
Note: Click image to view full size file.
Copy number change of DEPDC7:
| Dataset | Gene | EntrezID | Gain | Loss | Normal | Detail |
|---|---|---|---|---|---|---|
| GSE15526 | DEPDC7 | 91614 | 1 | 6 | 23 | |
| GSE20123 | DEPDC7 | 91614 | 1 | 5 | 24 | |
| GSE43470 | DEPDC7 | 91614 | 2 | 4 | 37 | |
| GSE46452 | DEPDC7 | 91614 | 8 | 5 | 46 | |
| GSE47630 | DEPDC7 | 91614 | 3 | 10 | 27 | |
| GSE54993 | DEPDC7 | 91614 | 3 | 0 | 67 | |
| GSE54994 | DEPDC7 | 91614 | 3 | 10 | 40 | |
| GSE60625 | DEPDC7 | 91614 | 0 | 0 | 11 | |
| GSE74703 | DEPDC7 | 91614 | 2 | 2 | 32 | |
| GSE74704 | DEPDC7 | 91614 | 0 | 4 | 16 | |
| TCGA | DEPDC7 | 91614 | 13 | 25 | 58 |
Total number of gains: 36; Total number of losses: 71; Total Number of normals: 381.
Somatic mutations of DEPDC7:
Generating mutation plots.
Highly correlated genes for DEPDC7:
Showing top 20/92 corelated genes with mean PCC>0.5.
| Gene1 | Gene2 | Mean PCC | Num. Datasets | Num. PCC<0 | Num. PCC>0.5 |
|---|---|---|---|---|---|
| DEPDC7 | NAIP | 0.67558 | 3 | 0 | 3 |
| DEPDC7 | F3 | 0.670486 | 4 | 0 | 3 |
| DEPDC7 | RNF152 | 0.649804 | 3 | 0 | 3 |
| DEPDC7 | SLC35F2 | 0.646362 | 4 | 0 | 3 |
| DEPDC7 | ERVMER34-1 | 0.643061 | 3 | 0 | 3 |
| DEPDC7 | LDLRAD3 | 0.633732 | 4 | 0 | 3 |
| DEPDC7 | KCNJ15 | 0.631535 | 5 | 0 | 5 |
| DEPDC7 | ACSL4 | 0.63074 | 4 | 0 | 3 |
| DEPDC7 | ZNF281 | 0.627847 | 3 | 0 | 3 |
| DEPDC7 | TWIST1 | 0.627546 | 4 | 0 | 3 |
| DEPDC7 | TUBA4A | 0.622601 | 4 | 0 | 4 |
| DEPDC7 | TSPAN5 | 0.615873 | 3 | 0 | 3 |
| DEPDC7 | PRNP | 0.614403 | 4 | 0 | 3 |
| DEPDC7 | MPP6 | 0.612697 | 3 | 0 | 3 |
| DEPDC7 | PPP1R14B | 0.611638 | 4 | 0 | 3 |
| DEPDC7 | ETS1 | 0.611362 | 3 | 0 | 3 |
| DEPDC7 | WNT10A | 0.60957 | 5 | 0 | 4 |
| DEPDC7 | PLEK2 | 0.598845 | 6 | 0 | 4 |
| DEPDC7 | STON2 | 0.598695 | 6 | 0 | 4 |
| DEPDC7 | ELK3 | 0.598179 | 4 | 0 | 3 |
For details and further investigation, click here