| Full name: phosphatidylinositol-4-phosphate 3-kinase catalytic subunit type 2 alpha | Alias Symbol: PI3K-C2alpha | ||
| Type: protein-coding gene | Cytoband: 11p15.1 | ||
| Entrez ID: 5286 | HGNC ID: HGNC:8971 | Ensembl Gene: ENSG00000011405 | OMIM ID: 603601 |
| Related drugs: ALPELISIB, APITOLISIB, BUPARLISIB, COPANLISIB, DACTOLISIB, GEDATOLISIB, GSK-2636771, PF-04691502, PI-103, PICTILISIB... [more] | |||
Expression of PIK3C2A:
| Dataset | Gene | EntrezID | Probe | Log2FC | Adj.pValue | Expression |
|---|---|---|---|---|---|---|
| GSE17351 | PIK3C2A | 5286 | 213070_at | -0.4541 | 0.0346 | |
| GSE20347 | PIK3C2A | 5286 | 213070_at | -0.5525 | 0.0005 | |
| GSE23400 | PIK3C2A | 5286 | 213070_at | -0.1757 | 0.0672 | |
| GSE26886 | PIK3C2A | 5286 | 213070_at | -0.1752 | 0.4721 | |
| GSE29001 | PIK3C2A | 5286 | 213070_at | -0.3096 | 0.2697 | |
| GSE38129 | PIK3C2A | 5286 | 213070_at | -0.5225 | 0.0000 | |
| GSE45670 | PIK3C2A | 5286 | 213070_at | -0.4475 | 0.0010 | |
| GSE53622 | PIK3C2A | 5286 | 55301 | -0.5545 | 0.0000 | |
| GSE53624 | PIK3C2A | 5286 | 55301 | -0.3653 | 0.0000 | |
| GSE63941 | PIK3C2A | 5286 | 213070_at | -0.4005 | 0.4439 | |
| GSE77861 | PIK3C2A | 5286 | 213070_at | 0.1466 | 0.7681 | |
| GSE97050 | PIK3C2A | 5286 | A_33_P3231878 | -0.3552 | 0.2286 | |
| SRP007169 | PIK3C2A | 5286 | RNAseq | 0.3004 | 0.4043 | |
| SRP008496 | PIK3C2A | 5286 | RNAseq | 0.5070 | 0.0282 | |
| SRP064894 | PIK3C2A | 5286 | RNAseq | -0.3288 | 0.2672 | |
| SRP133303 | PIK3C2A | 5286 | RNAseq | 0.0498 | 0.7342 | |
| SRP159526 | PIK3C2A | 5286 | RNAseq | -0.5866 | 0.0029 | |
| SRP193095 | PIK3C2A | 5286 | RNAseq | -0.2981 | 0.0014 | |
| SRP219564 | PIK3C2A | 5286 | RNAseq | -0.4145 | 0.1303 | |
| TCGA | PIK3C2A | 5286 | RNAseq | -0.2208 | 0.0000 |
Upregulated datasets: 0; Downregulated datasets: 0.
Survival by PIK3C2A expression:
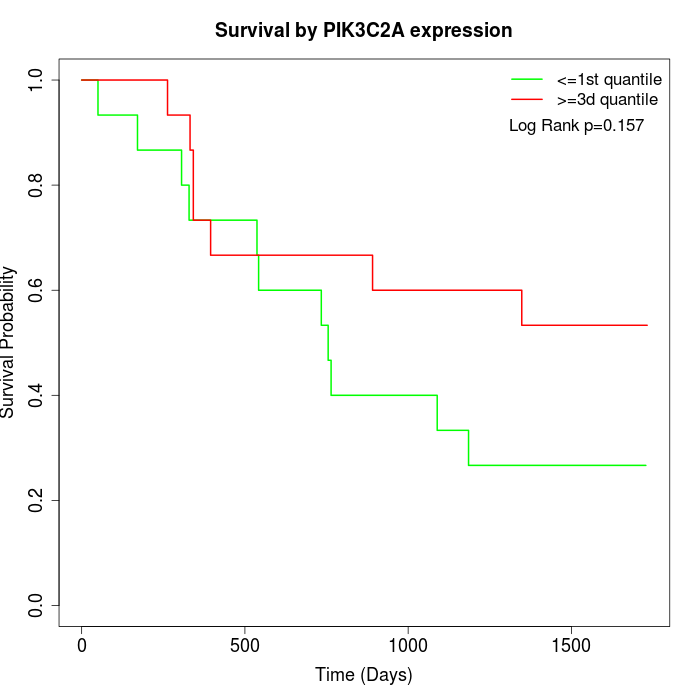 | 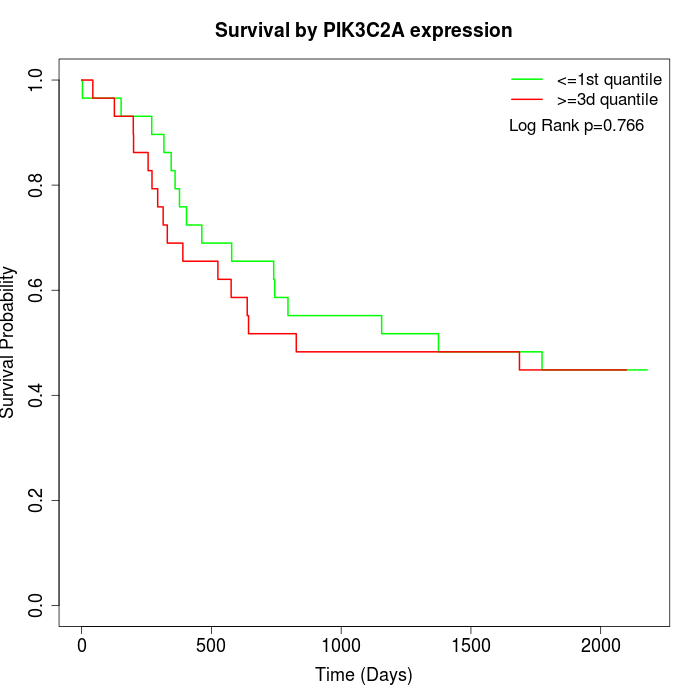 | 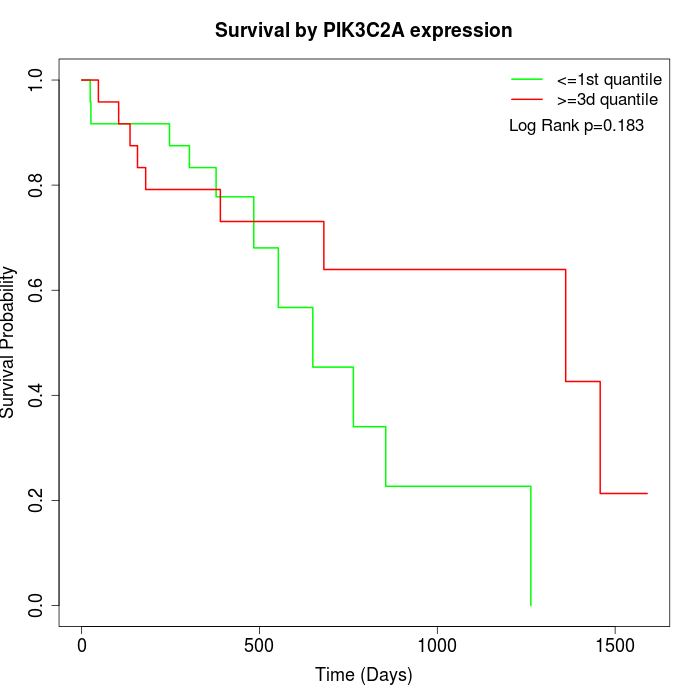 |
| GSE53622 | GSE53624 | TCGA |
Note: Click image to view full size file.
Copy number change of PIK3C2A:
| Dataset | Gene | EntrezID | Gain | Loss | Normal | Detail |
|---|---|---|---|---|---|---|
| GSE15526 | PIK3C2A | 5286 | 0 | 10 | 20 | |
| GSE20123 | PIK3C2A | 5286 | 0 | 10 | 20 | |
| GSE43470 | PIK3C2A | 5286 | 1 | 5 | 37 | |
| GSE46452 | PIK3C2A | 5286 | 7 | 5 | 47 | |
| GSE47630 | PIK3C2A | 5286 | 3 | 10 | 27 | |
| GSE54993 | PIK3C2A | 5286 | 3 | 0 | 67 | |
| GSE54994 | PIK3C2A | 5286 | 2 | 14 | 37 | |
| GSE60625 | PIK3C2A | 5286 | 0 | 0 | 11 | |
| GSE74703 | PIK3C2A | 5286 | 1 | 3 | 32 | |
| GSE74704 | PIK3C2A | 5286 | 0 | 9 | 11 | |
| TCGA | PIK3C2A | 5286 | 11 | 29 | 56 |
Total number of gains: 28; Total number of losses: 95; Total Number of normals: 365.
Somatic mutations of PIK3C2A:
Generating mutation plots.
Highly correlated genes for PIK3C2A:
Showing top 20/1063 corelated genes with mean PCC>0.5.
| Gene1 | Gene2 | Mean PCC | Num. Datasets | Num. PCC<0 | Num. PCC>0.5 |
|---|---|---|---|---|---|
| PIK3C2A | ANAPC16 | 0.784696 | 4 | 0 | 4 |
| PIK3C2A | TPCN1 | 0.770846 | 3 | 0 | 3 |
| PIK3C2A | USP54 | 0.769803 | 3 | 0 | 3 |
| PIK3C2A | ZNF425 | 0.758137 | 3 | 0 | 3 |
| PIK3C2A | GRHPR | 0.754852 | 4 | 0 | 4 |
| PIK3C2A | GOT1 | 0.747713 | 3 | 0 | 3 |
| PIK3C2A | CYYR1 | 0.744196 | 5 | 0 | 5 |
| PIK3C2A | UBXN10 | 0.739643 | 3 | 0 | 3 |
| PIK3C2A | SMAD5 | 0.735802 | 4 | 0 | 4 |
| PIK3C2A | RNF185 | 0.734401 | 4 | 0 | 3 |
| PIK3C2A | BRK1 | 0.730217 | 4 | 0 | 4 |
| PIK3C2A | ADAMTS9-AS2 | 0.729275 | 4 | 0 | 4 |
| PIK3C2A | FBXL14 | 0.729029 | 4 | 0 | 4 |
| PIK3C2A | AMD1 | 0.726083 | 3 | 0 | 3 |
| PIK3C2A | MRVI1 | 0.72487 | 4 | 0 | 4 |
| PIK3C2A | NFIA | 0.723091 | 4 | 0 | 4 |
| PIK3C2A | TSPAN31 | 0.721989 | 3 | 0 | 3 |
| PIK3C2A | PPP1CC | 0.720179 | 4 | 0 | 4 |
| PIK3C2A | HOXA4 | 0.717467 | 4 | 0 | 4 |
| PIK3C2A | MYOCD | 0.716405 | 4 | 0 | 4 |
For details and further investigation, click here