| Full name: GC-rich promoter binding protein 1 like 1 | Alias Symbol: SP192 | ||
| Type: protein-coding gene | Cytoband: 1p34.1 | ||
| Entrez ID: 60313 | HGNC ID: HGNC:28843 | Ensembl Gene: ENSG00000159592 | OMIM ID: |
Expression of GPBP1L1:
| Dataset | Gene | EntrezID | Probe | Log2FC | Adj.pValue | Expression |
|---|---|---|---|---|---|---|
| GSE17351 | GPBP1L1 | 60313 | 217877_s_at | 0.1487 | 0.7098 | |
| GSE20347 | GPBP1L1 | 60313 | 217877_s_at | -0.2438 | 0.0184 | |
| GSE23400 | GPBP1L1 | 60313 | 217877_s_at | -0.1637 | 0.0044 | |
| GSE26886 | GPBP1L1 | 60313 | 217877_s_at | -0.7287 | 0.0016 | |
| GSE29001 | GPBP1L1 | 60313 | 217877_s_at | -0.3553 | 0.0877 | |
| GSE38129 | GPBP1L1 | 60313 | 217877_s_at | -0.2012 | 0.0396 | |
| GSE45670 | GPBP1L1 | 60313 | 217877_s_at | -0.0634 | 0.6395 | |
| GSE53622 | GPBP1L1 | 60313 | 39910 | -0.2716 | 0.0000 | |
| GSE53624 | GPBP1L1 | 60313 | 39910 | -0.2602 | 0.0000 | |
| GSE63941 | GPBP1L1 | 60313 | 222452_s_at | 1.1401 | 0.0039 | |
| GSE77861 | GPBP1L1 | 60313 | 222452_s_at | -0.2261 | 0.3709 | |
| GSE97050 | GPBP1L1 | 60313 | A_23_P593 | -0.0998 | 0.6891 | |
| SRP007169 | GPBP1L1 | 60313 | RNAseq | -0.8353 | 0.0194 | |
| SRP008496 | GPBP1L1 | 60313 | RNAseq | -0.9101 | 0.0001 | |
| SRP064894 | GPBP1L1 | 60313 | RNAseq | -0.4659 | 0.0022 | |
| SRP133303 | GPBP1L1 | 60313 | RNAseq | -0.1473 | 0.3684 | |
| SRP159526 | GPBP1L1 | 60313 | RNAseq | -0.4775 | 0.0083 | |
| SRP193095 | GPBP1L1 | 60313 | RNAseq | -0.5659 | 0.0000 | |
| SRP219564 | GPBP1L1 | 60313 | RNAseq | -0.2469 | 0.4875 | |
| TCGA | GPBP1L1 | 60313 | RNAseq | -0.0709 | 0.0890 |
Upregulated datasets: 1; Downregulated datasets: 0.
Survival by GPBP1L1 expression:
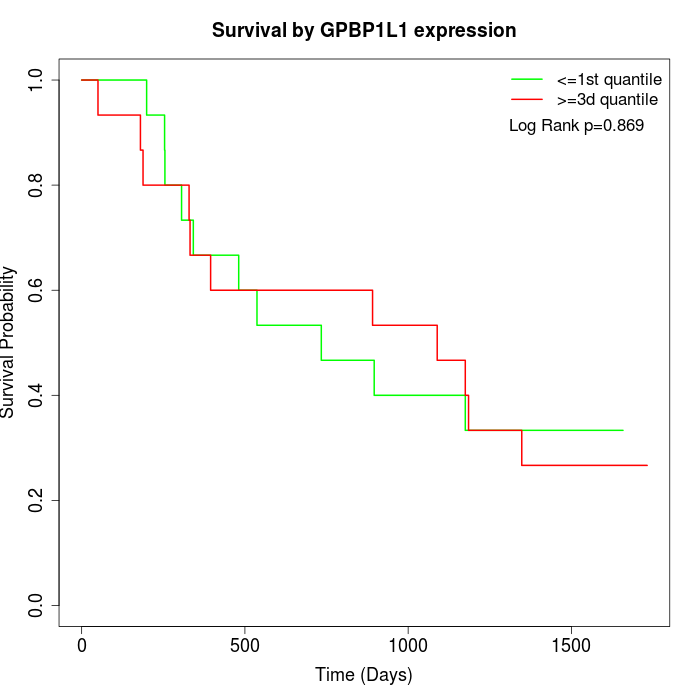 | 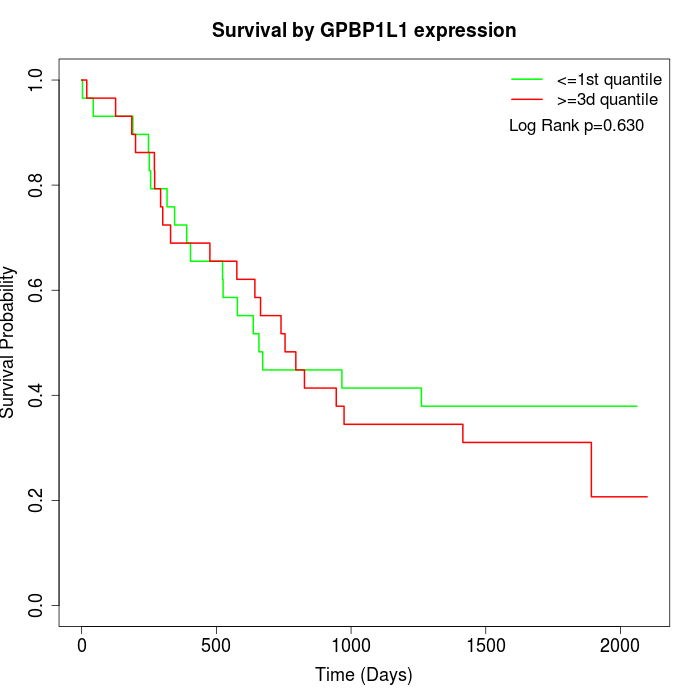 | 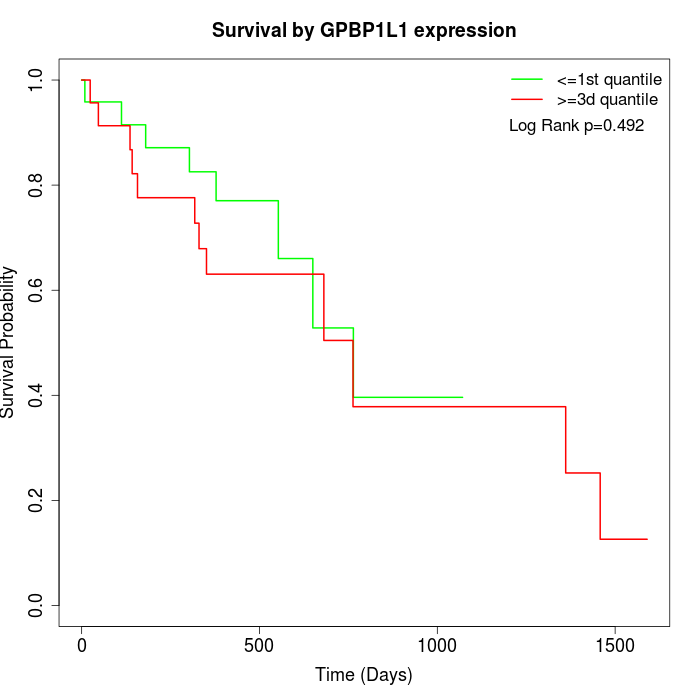 |
| GSE53622 | GSE53624 | TCGA |
Note: Click image to view full size file.
Copy number change of GPBP1L1:
| Dataset | Gene | EntrezID | Gain | Loss | Normal | Detail |
|---|---|---|---|---|---|---|
| GSE15526 | GPBP1L1 | 60313 | 4 | 3 | 23 | |
| GSE20123 | GPBP1L1 | 60313 | 4 | 2 | 24 | |
| GSE43470 | GPBP1L1 | 60313 | 6 | 2 | 35 | |
| GSE46452 | GPBP1L1 | 60313 | 2 | 1 | 56 | |
| GSE47630 | GPBP1L1 | 60313 | 9 | 3 | 28 | |
| GSE54993 | GPBP1L1 | 60313 | 0 | 1 | 69 | |
| GSE54994 | GPBP1L1 | 60313 | 11 | 2 | 40 | |
| GSE60625 | GPBP1L1 | 60313 | 0 | 0 | 11 | |
| GSE74703 | GPBP1L1 | 60313 | 5 | 1 | 30 | |
| GSE74704 | GPBP1L1 | 60313 | 2 | 0 | 18 | |
| TCGA | GPBP1L1 | 60313 | 11 | 16 | 69 |
Total number of gains: 54; Total number of losses: 31; Total Number of normals: 403.
Somatic mutations of GPBP1L1:
Generating mutation plots.
Highly correlated genes for GPBP1L1:
Showing top 20/547 corelated genes with mean PCC>0.5.
| Gene1 | Gene2 | Mean PCC | Num. Datasets | Num. PCC<0 | Num. PCC>0.5 |
|---|---|---|---|---|---|
| GPBP1L1 | NOC2L | 0.772964 | 4 | 0 | 4 |
| GPBP1L1 | TMEM69 | 0.772878 | 4 | 0 | 3 |
| GPBP1L1 | HNRNPAB | 0.747561 | 3 | 0 | 3 |
| GPBP1L1 | LCMT1 | 0.74188 | 3 | 0 | 3 |
| GPBP1L1 | XPNPEP1 | 0.741571 | 3 | 0 | 3 |
| GPBP1L1 | LINC01128 | 0.725098 | 3 | 0 | 3 |
| GPBP1L1 | NDUFA10 | 0.724634 | 3 | 0 | 3 |
| GPBP1L1 | NDUFS3 | 0.724559 | 3 | 0 | 3 |
| GPBP1L1 | CCNYL1 | 0.712066 | 3 | 0 | 3 |
| GPBP1L1 | C5orf51 | 0.709375 | 3 | 0 | 3 |
| GPBP1L1 | GLUD2 | 0.708825 | 4 | 0 | 3 |
| GPBP1L1 | MRPS15 | 0.702231 | 3 | 0 | 3 |
| GPBP1L1 | HGS | 0.700976 | 4 | 0 | 4 |
| GPBP1L1 | ANKRD28 | 0.697868 | 3 | 0 | 3 |
| GPBP1L1 | TNPO3 | 0.697622 | 4 | 0 | 3 |
| GPBP1L1 | ZXDC | 0.69686 | 3 | 0 | 3 |
| GPBP1L1 | NASP | 0.695349 | 4 | 0 | 3 |
| GPBP1L1 | IPMK | 0.693558 | 3 | 0 | 3 |
| GPBP1L1 | ZNF140 | 0.69229 | 3 | 0 | 3 |
| GPBP1L1 | EPB41L5 | 0.692266 | 3 | 0 | 3 |
For details and further investigation, click here