| Full name: tripartite motif containing 10 | Alias Symbol: RFB30|HERF1 | ||
| Type: protein-coding gene | Cytoband: 6p22.1 | ||
| Entrez ID: 10107 | HGNC ID: HGNC:10072 | Ensembl Gene: ENSG00000204613 | OMIM ID: 605701 |
Expression of TRIM10:
| Dataset | Gene | EntrezID | Probe | Log2FC | Adj.pValue | Expression |
|---|---|---|---|---|---|---|
| GSE17351 | TRIM10 | 10107 | 210579_s_at | -0.0421 | 0.8709 | |
| GSE20347 | TRIM10 | 10107 | 210579_s_at | 0.0337 | 0.6475 | |
| GSE23400 | TRIM10 | 10107 | 221627_at | -0.1599 | 0.0013 | |
| GSE26886 | TRIM10 | 10107 | 210579_s_at | 0.1888 | 0.0684 | |
| GSE29001 | TRIM10 | 10107 | 221627_at | -0.0802 | 0.7156 | |
| GSE38129 | TRIM10 | 10107 | 210579_s_at | -0.0847 | 0.1566 | |
| GSE45670 | TRIM10 | 10107 | 210579_s_at | 0.0954 | 0.1260 | |
| GSE53622 | TRIM10 | 10107 | 125594 | 0.2061 | 0.0204 | |
| GSE53624 | TRIM10 | 10107 | 125594 | 0.3081 | 0.0021 | |
| GSE63941 | TRIM10 | 10107 | 221627_at | 0.1671 | 0.3893 | |
| GSE77861 | TRIM10 | 10107 | 221627_at | -0.1363 | 0.2651 | |
| GSE97050 | TRIM10 | 10107 | A_23_P420831 | -0.0263 | 0.9063 | |
| TCGA | TRIM10 | 10107 | RNAseq | 0.3178 | 0.7353 |
Upregulated datasets: 0; Downregulated datasets: 0.
Survival by TRIM10 expression:
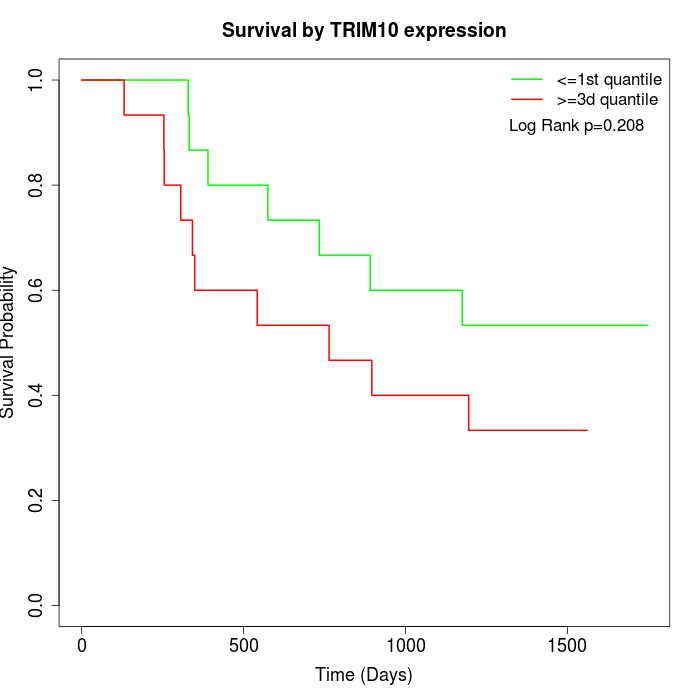 | 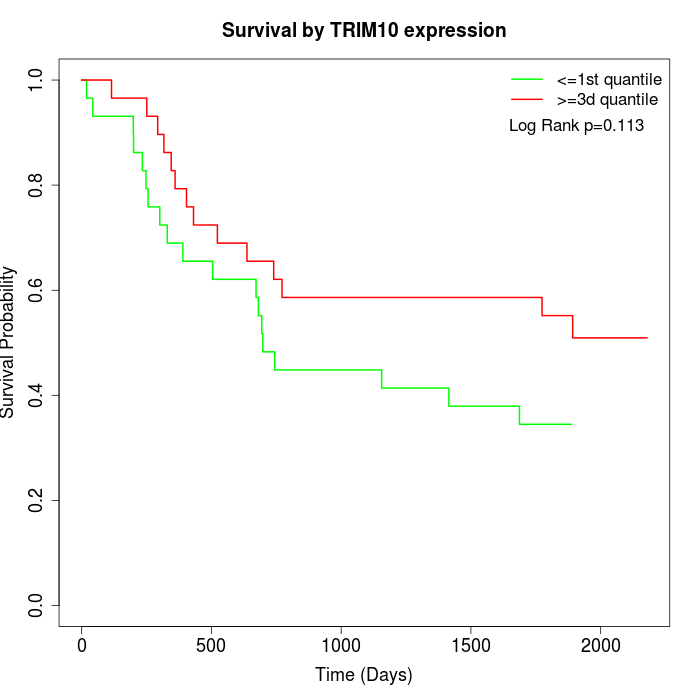 |  |
| GSE53622 | GSE53624 | TCGA |
Note: Click image to view full size file.
Copy number change of TRIM10:
| Dataset | Gene | EntrezID | Gain | Loss | Normal | Detail |
|---|---|---|---|---|---|---|
| GSE15526 | TRIM10 | 10107 | 4 | 1 | 25 | |
| GSE20123 | TRIM10 | 10107 | 4 | 1 | 25 | |
| GSE43470 | TRIM10 | 10107 | 5 | 0 | 38 | |
| GSE46452 | TRIM10 | 10107 | 1 | 10 | 48 | |
| GSE47630 | TRIM10 | 10107 | 7 | 3 | 30 | |
| GSE54993 | TRIM10 | 10107 | 2 | 1 | 67 | |
| GSE54994 | TRIM10 | 10107 | 11 | 4 | 38 | |
| GSE60625 | TRIM10 | 10107 | 0 | 1 | 10 | |
| GSE74703 | TRIM10 | 10107 | 5 | 0 | 31 | |
| GSE74704 | TRIM10 | 10107 | 2 | 0 | 18 | |
| TCGA | TRIM10 | 10107 | 16 | 17 | 63 |
Total number of gains: 57; Total number of losses: 38; Total Number of normals: 393.
Somatic mutations of TRIM10:
Generating mutation plots.
Highly correlated genes for TRIM10:
Showing top 20/1189 corelated genes with mean PCC>0.5.
| Gene1 | Gene2 | Mean PCC | Num. Datasets | Num. PCC<0 | Num. PCC>0.5 |
|---|---|---|---|---|---|
| TRIM10 | GRIK4 | 0.860205 | 3 | 0 | 3 |
| TRIM10 | STRC | 0.853528 | 3 | 0 | 3 |
| TRIM10 | NRSN1 | 0.825477 | 3 | 0 | 3 |
| TRIM10 | OR2T27 | 0.818751 | 3 | 0 | 3 |
| TRIM10 | DCDC1 | 0.815619 | 3 | 0 | 3 |
| TRIM10 | PLA2G2C | 0.815432 | 3 | 0 | 3 |
| TRIM10 | PGC | 0.808453 | 3 | 0 | 3 |
| TRIM10 | KRTAP10-12 | 0.797622 | 3 | 0 | 3 |
| TRIM10 | TBC1D1 | 0.791796 | 3 | 0 | 3 |
| TRIM10 | YY2 | 0.790327 | 3 | 0 | 3 |
| TRIM10 | OR2A5 | 0.789339 | 3 | 0 | 3 |
| TRIM10 | CELF5 | 0.78405 | 3 | 0 | 3 |
| TRIM10 | DEFB128 | 0.781547 | 3 | 0 | 3 |
| TRIM10 | MAGEA8 | 0.780072 | 3 | 0 | 3 |
| TRIM10 | C9orf153 | 0.776618 | 3 | 0 | 3 |
| TRIM10 | ABCC6 | 0.775183 | 3 | 0 | 3 |
| TRIM10 | KRTAP4-8 | 0.771602 | 4 | 0 | 4 |
| TRIM10 | MFSD6L | 0.765766 | 3 | 0 | 3 |
| TRIM10 | SLC39A5 | 0.765346 | 3 | 0 | 3 |
| TRIM10 | CIB3 | 0.765002 | 4 | 0 | 4 |
For details and further investigation, click here