| Full name: 5-hydroxytryptamine receptor 3A | Alias Symbol: 5-HT3R|5-HT3A | ||
| Type: protein-coding gene | Cytoband: 11q23.2 | ||
| Entrez ID: 3359 | HGNC ID: HGNC:5297 | Ensembl Gene: ENSG00000166736 | OMIM ID: 182139 |
| Related drugs: ALOSETRON, ALOSETRON HYDROCHLORIDE, CHEMBL1188853, CILANSETRON, CISAPRIDE, DOLASETRON, Dolasetron Mesylate, ESMIRTAZAPINE, GRANISETRON, GRANISETRON HYDROCHLORIDE... [more] | |||
HTR3A involved pathways:
| KEGG pathway | Description | View |
|---|---|---|
| hsa04726 | Serotonergic synapse | |
| hsa04742 | Taste transduction |
Expression of HTR3A:
| Dataset | Gene | EntrezID | Probe | Log2FC | Adj.pValue | Expression |
|---|---|---|---|---|---|---|
| GSE17351 | HTR3A | 3359 | 216615_s_at | -0.2834 | 0.4699 | |
| GSE20347 | HTR3A | 3359 | 216615_s_at | -0.0526 | 0.6250 | |
| GSE23400 | HTR3A | 3359 | 216615_s_at | -0.2010 | 0.0000 | |
| GSE26886 | HTR3A | 3359 | 217002_s_at | -0.5365 | 0.0020 | |
| GSE29001 | HTR3A | 3359 | 216615_s_at | -0.3372 | 0.0391 | |
| GSE38129 | HTR3A | 3359 | 216615_s_at | -0.2719 | 0.0084 | |
| GSE45670 | HTR3A | 3359 | 216615_s_at | 0.1355 | 0.3607 | |
| GSE53622 | HTR3A | 3359 | 22396 | -1.4960 | 0.0000 | |
| GSE53624 | HTR3A | 3359 | 22396 | -0.9432 | 0.0000 | |
| GSE63941 | HTR3A | 3359 | 216615_s_at | 0.3953 | 0.1944 | |
| GSE77861 | HTR3A | 3359 | 216615_s_at | -0.2139 | 0.1383 | |
| GSE97050 | HTR3A | 3359 | A_24_P150068 | -0.0806 | 0.7457 | |
| TCGA | HTR3A | 3359 | RNAseq | -1.0645 | 0.2362 |
Upregulated datasets: 0; Downregulated datasets: 1.
Survival by HTR3A expression:
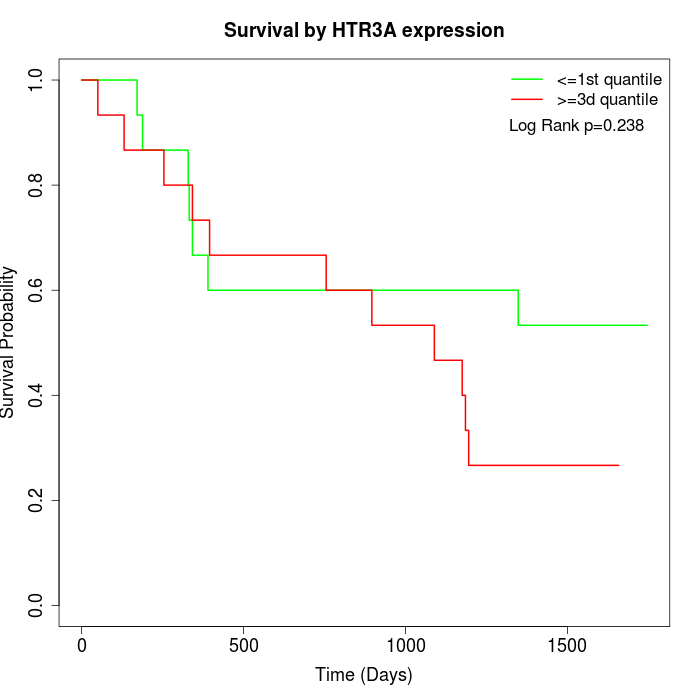 | 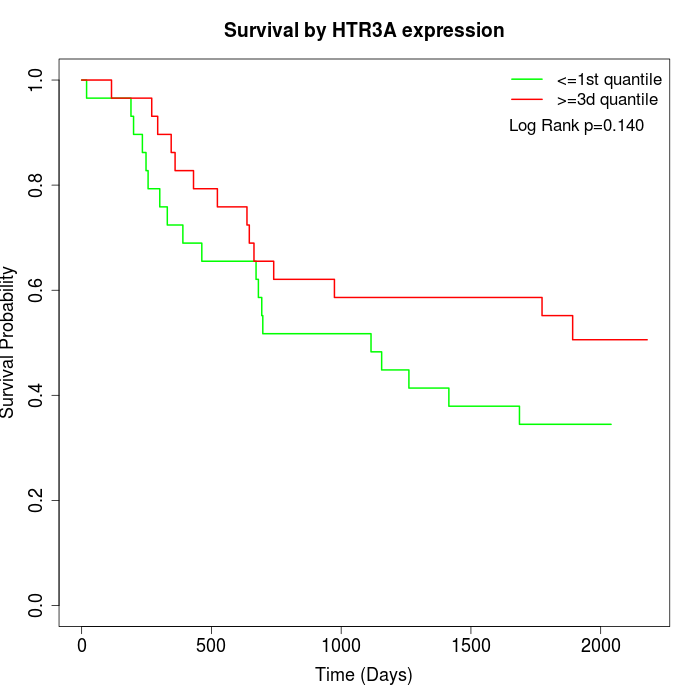 | 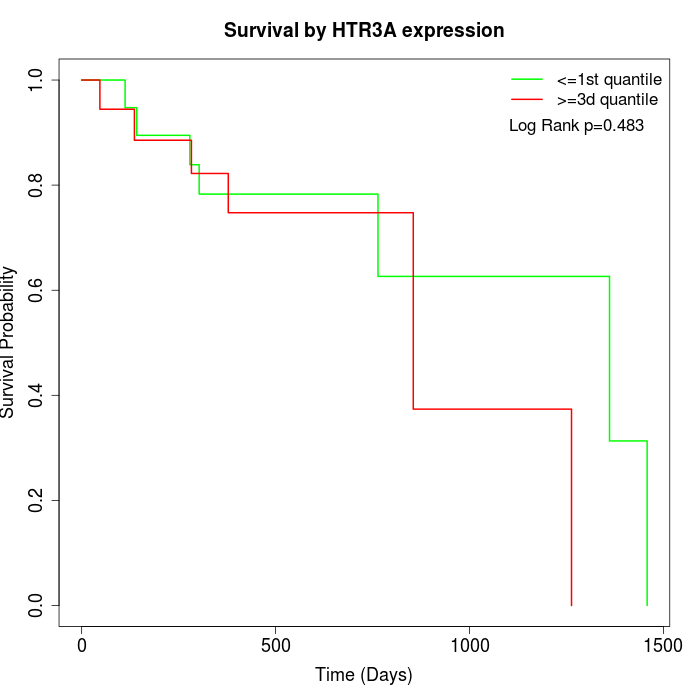 |
| GSE53622 | GSE53624 | TCGA |
Note: Click image to view full size file.
Copy number change of HTR3A:
| Dataset | Gene | EntrezID | Gain | Loss | Normal | Detail |
|---|---|---|---|---|---|---|
| GSE15526 | HTR3A | 3359 | 0 | 13 | 17 | |
| GSE20123 | HTR3A | 3359 | 0 | 13 | 17 | |
| GSE43470 | HTR3A | 3359 | 2 | 7 | 34 | |
| GSE46452 | HTR3A | 3359 | 3 | 26 | 30 | |
| GSE47630 | HTR3A | 3359 | 2 | 19 | 19 | |
| GSE54993 | HTR3A | 3359 | 10 | 0 | 60 | |
| GSE54994 | HTR3A | 3359 | 5 | 19 | 29 | |
| GSE60625 | HTR3A | 3359 | 0 | 3 | 8 | |
| GSE74703 | HTR3A | 3359 | 1 | 5 | 30 | |
| GSE74704 | HTR3A | 3359 | 0 | 9 | 11 | |
| TCGA | HTR3A | 3359 | 5 | 49 | 42 |
Total number of gains: 28; Total number of losses: 163; Total Number of normals: 297.
Somatic mutations of HTR3A:
Generating mutation plots.
Highly correlated genes for HTR3A:
Showing top 20/896 corelated genes with mean PCC>0.5.
| Gene1 | Gene2 | Mean PCC | Num. Datasets | Num. PCC<0 | Num. PCC>0.5 |
|---|---|---|---|---|---|
| HTR3A | RNF151 | 0.851604 | 3 | 0 | 3 |
| HTR3A | MFSD2B | 0.8009 | 3 | 0 | 3 |
| HTR3A | OR2Z1 | 0.79873 | 3 | 0 | 3 |
| HTR3A | LRFN2 | 0.793595 | 3 | 0 | 3 |
| HTR3A | HSPA12B | 0.792956 | 3 | 0 | 3 |
| HTR3A | OR10G8 | 0.792398 | 3 | 0 | 3 |
| HTR3A | TDGF1 | 0.790476 | 3 | 0 | 3 |
| HTR3A | SPATA31E1 | 0.786382 | 3 | 0 | 3 |
| HTR3A | OR51T1 | 0.781528 | 3 | 0 | 3 |
| HTR3A | CLDN24 | 0.780703 | 3 | 0 | 3 |
| HTR3A | KRTAP20-1 | 0.778694 | 3 | 0 | 3 |
| HTR3A | KRTAP6-1 | 0.773657 | 3 | 0 | 3 |
| HTR3A | TPRX1 | 0.773136 | 3 | 0 | 3 |
| HTR3A | MCF2L | 0.767536 | 3 | 0 | 3 |
| HTR3A | GDF7 | 0.76244 | 3 | 0 | 3 |
| HTR3A | OR10G3 | 0.75775 | 3 | 0 | 3 |
| HTR3A | CLEC4D | 0.753941 | 3 | 0 | 3 |
| HTR3A | ENTPD8 | 0.75274 | 3 | 0 | 3 |
| HTR3A | SP7 | 0.744774 | 3 | 0 | 3 |
| HTR3A | FAM163B | 0.740756 | 3 | 0 | 3 |
For details and further investigation, click here