| Full name: interleukin 5 | Alias Symbol: IL-5|EDF|TRF | ||
| Type: protein-coding gene | Cytoband: 5q31.1 | ||
| Entrez ID: 3567 | HGNC ID: HGNC:6016 | Ensembl Gene: ENSG00000113525 | OMIM ID: 147850 |
| Related drugs: CYCLOPHOSPHAMIDE, CYCLOSPORINE, MEPOLIZUMAB, METHYLPREDNISOLONE, RESLIZUMAB... [more] | |||
IL5 involved pathways:
| KEGG pathway | Description | View |
|---|---|---|
| hsa04630 | Jak-STAT signaling pathway | |
| hsa05321 | Inflammatory bowel disease (IBD) |
Expression of IL5:
| Dataset | Gene | EntrezID | Probe | Log2FC | Adj.pValue | Expression |
|---|---|---|---|---|---|---|
| GSE17351 | IL5 | 3567 | 207952_at | -0.0638 | 0.8034 | |
| GSE20347 | IL5 | 3567 | 207952_at | -0.1014 | 0.0574 | |
| GSE23400 | IL5 | 3567 | 207952_at | -0.0559 | 0.0046 | |
| GSE26886 | IL5 | 3567 | 207952_at | -0.0110 | 0.9202 | |
| GSE29001 | IL5 | 3567 | 207952_at | -0.0232 | 0.8398 | |
| GSE38129 | IL5 | 3567 | 207952_at | -0.0785 | 0.1784 | |
| GSE45670 | IL5 | 3567 | 207952_at | -0.1143 | 0.1234 | |
| GSE53622 | IL5 | 3567 | 113647 | -0.3442 | 0.0003 | |
| GSE53624 | IL5 | 3567 | 113647 | 0.0015 | 0.9902 | |
| GSE63941 | IL5 | 3567 | 207952_at | 0.2627 | 0.0660 | |
| GSE77861 | IL5 | 3567 | 207952_at | -0.1017 | 0.3776 | |
| TCGA | IL5 | 3567 | RNAseq | -0.3988 | 0.8019 |
Upregulated datasets: 0; Downregulated datasets: 0.
Survival by IL5 expression:
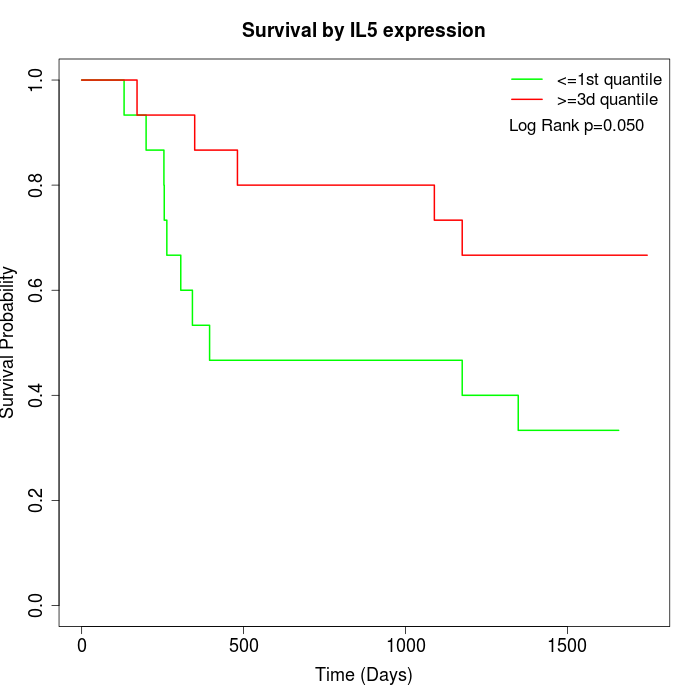 | 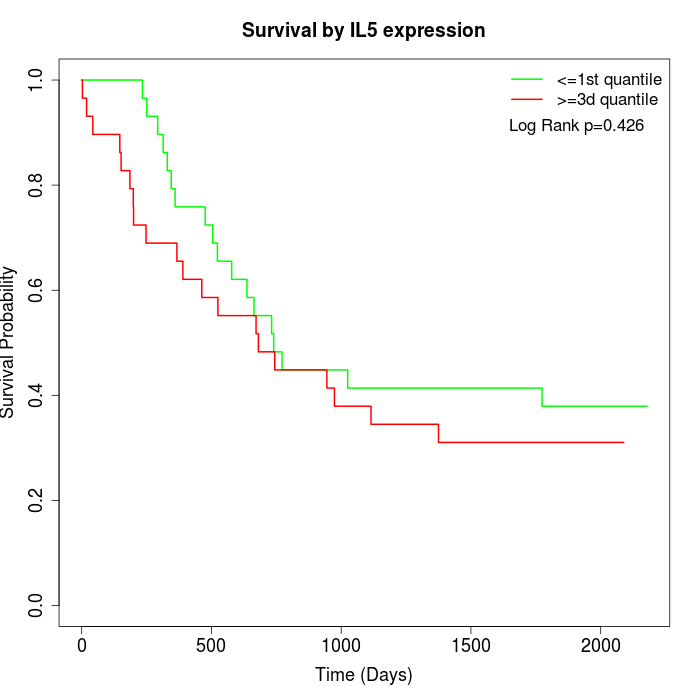 | 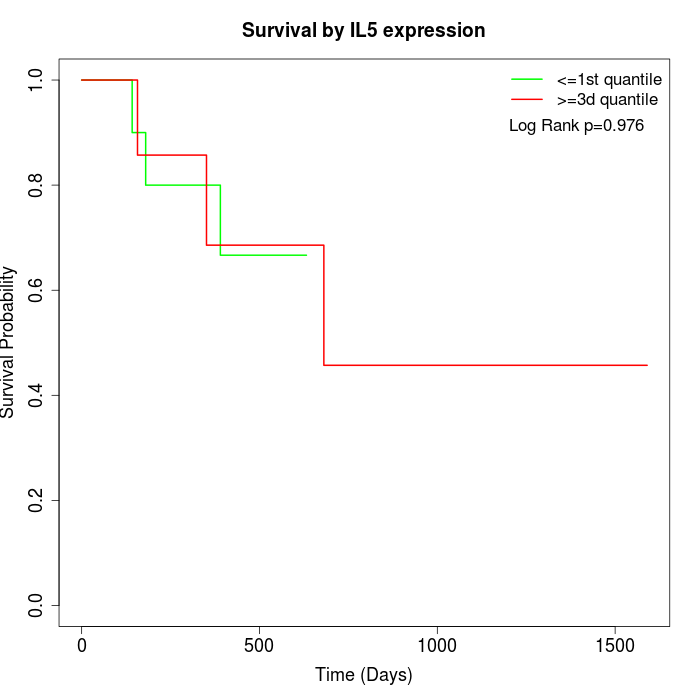 |
| GSE53622 | GSE53624 | TCGA |
Note: Click image to view full size file.
Copy number change of IL5:
| Dataset | Gene | EntrezID | Gain | Loss | Normal | Detail |
|---|---|---|---|---|---|---|
| GSE15526 | IL5 | 3567 | 1 | 11 | 18 | |
| GSE20123 | IL5 | 3567 | 2 | 11 | 17 | |
| GSE43470 | IL5 | 3567 | 2 | 9 | 32 | |
| GSE46452 | IL5 | 3567 | 0 | 27 | 32 | |
| GSE47630 | IL5 | 3567 | 0 | 21 | 19 | |
| GSE54993 | IL5 | 3567 | 9 | 1 | 60 | |
| GSE54994 | IL5 | 3567 | 2 | 14 | 37 | |
| GSE60625 | IL5 | 3567 | 0 | 0 | 11 | |
| GSE74703 | IL5 | 3567 | 2 | 6 | 28 | |
| GSE74704 | IL5 | 3567 | 1 | 5 | 14 | |
| TCGA | IL5 | 3567 | 3 | 39 | 54 |
Total number of gains: 22; Total number of losses: 144; Total Number of normals: 322.
Somatic mutations of IL5:
Generating mutation plots.
Highly correlated genes for IL5:
Showing top 20/328 corelated genes with mean PCC>0.5.
| Gene1 | Gene2 | Mean PCC | Num. Datasets | Num. PCC<0 | Num. PCC>0.5 |
|---|---|---|---|---|---|
| IL5 | PCAT4 | 0.697378 | 3 | 0 | 3 |
| IL5 | JSRP1 | 0.694848 | 4 | 0 | 4 |
| IL5 | CEACAM21 | 0.691281 | 3 | 0 | 3 |
| IL5 | DCDC2B | 0.683375 | 4 | 0 | 4 |
| IL5 | PLEKHN1 | 0.676628 | 4 | 0 | 4 |
| IL5 | COL26A1 | 0.672226 | 4 | 0 | 3 |
| IL5 | RBBP8NL | 0.667269 | 3 | 0 | 3 |
| IL5 | LINC00598 | 0.659911 | 3 | 0 | 3 |
| IL5 | UPB1 | 0.656744 | 3 | 0 | 3 |
| IL5 | PPP1R3F | 0.651865 | 3 | 0 | 3 |
| IL5 | TRIM62 | 0.649893 | 3 | 0 | 3 |
| IL5 | LIPF | 0.643042 | 3 | 0 | 3 |
| IL5 | CES4A | 0.64148 | 3 | 0 | 3 |
| IL5 | PRDM14 | 0.640527 | 4 | 0 | 3 |
| IL5 | TRPV6 | 0.638159 | 5 | 0 | 5 |
| IL5 | FBLL1 | 0.633912 | 3 | 0 | 3 |
| IL5 | ENHO | 0.629963 | 3 | 0 | 3 |
| IL5 | FMN2 | 0.629298 | 4 | 0 | 3 |
| IL5 | NRG1 | 0.628901 | 4 | 0 | 3 |
| IL5 | PRAMEF10 | 0.627049 | 3 | 0 | 3 |
For details and further investigation, click here