| Full name: lipocalin 1 | Alias Symbol: VEGP|TP|PMFA|MGC71975|TLC | ||
| Type: protein-coding gene | Cytoband: 9q34.3 | ||
| Entrez ID: 3933 | HGNC ID: HGNC:6525 | Ensembl Gene: ENSG00000160349 | OMIM ID: 151675 |
Expression of LCN1:
| Dataset | Gene | EntrezID | Probe | Log2FC | Adj.pValue | Expression |
|---|---|---|---|---|---|---|
| GSE17351 | LCN1 | 3933 | 207930_at | -1.1615 | 0.4407 | |
| GSE20347 | LCN1 | 3933 | 207930_at | -0.1046 | 0.1924 | |
| GSE23400 | LCN1 | 3933 | 207930_at | -0.4486 | 0.0008 | |
| GSE26886 | LCN1 | 3933 | 207930_at | 0.2497 | 0.1235 | |
| GSE29001 | LCN1 | 3933 | 207930_at | -0.0327 | 0.8224 | |
| GSE38129 | LCN1 | 3933 | 207930_at | -0.2114 | 0.2216 | |
| GSE45670 | LCN1 | 3933 | 207930_at | -0.4244 | 0.0487 | |
| GSE53622 | LCN1 | 3933 | 32663 | -1.5867 | 0.0001 | |
| GSE53624 | LCN1 | 3933 | 32663 | -2.2115 | 0.0000 | |
| GSE63941 | LCN1 | 3933 | 207930_at | 0.3014 | 0.1227 | |
| GSE77861 | LCN1 | 3933 | 207930_at | -0.0005 | 0.9982 | |
| GSE97050 | LCN1 | 3933 | A_33_P3366431 | -0.9963 | 0.2204 | |
| SRP133303 | LCN1 | 3933 | RNAseq | -8.3013 | 0.0000 | |
| TCGA | LCN1 | 3933 | RNAseq | 1.5128 | 0.3210 |
Upregulated datasets: 0; Downregulated datasets: 3.
Survival by LCN1 expression:
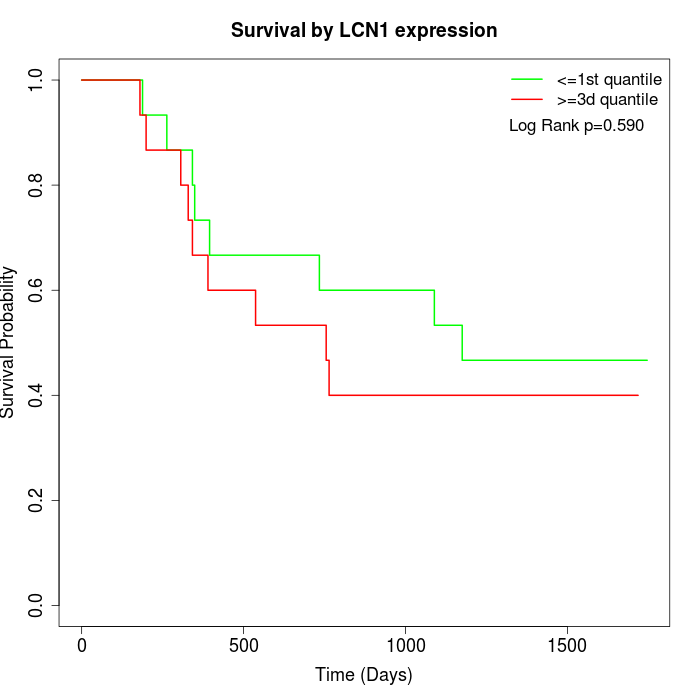 | 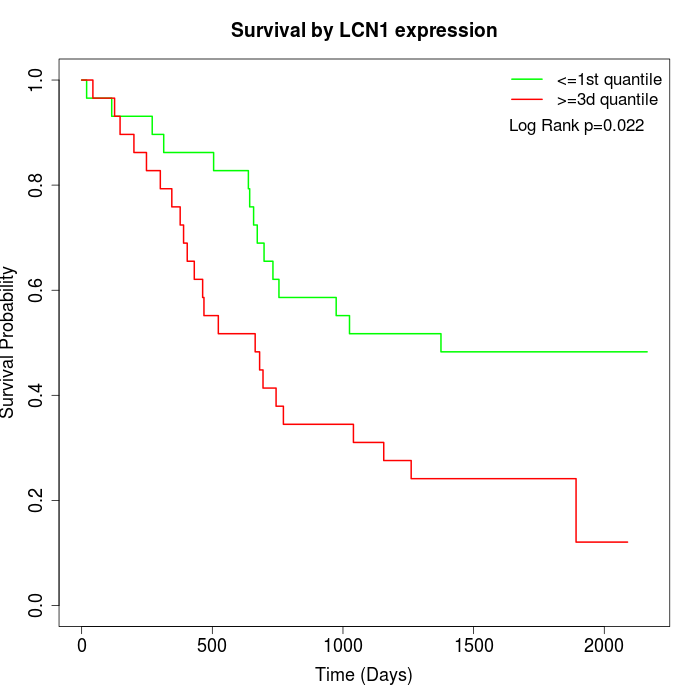 | 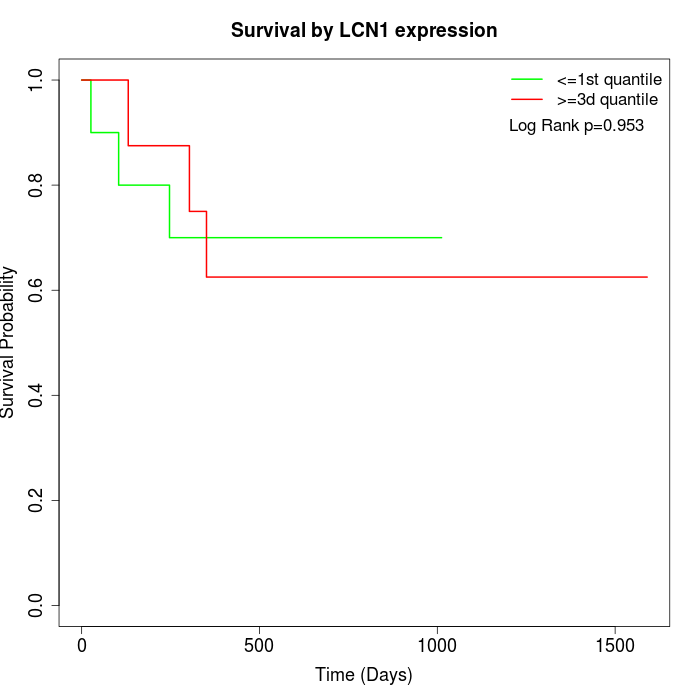 |
| GSE53622 | GSE53624 | TCGA |
Note: Click image to view full size file.
Copy number change of LCN1:
| Dataset | Gene | EntrezID | Gain | Loss | Normal | Detail |
|---|---|---|---|---|---|---|
| GSE15526 | LCN1 | 3933 | 4 | 7 | 19 | |
| GSE20123 | LCN1 | 3933 | 4 | 7 | 19 | |
| GSE43470 | LCN1 | 3933 | 3 | 7 | 33 | |
| GSE46452 | LCN1 | 3933 | 6 | 13 | 40 | |
| GSE47630 | LCN1 | 3933 | 6 | 15 | 19 | |
| GSE54993 | LCN1 | 3933 | 3 | 3 | 64 | |
| GSE54994 | LCN1 | 3933 | 11 | 9 | 33 | |
| GSE60625 | LCN1 | 3933 | 0 | 0 | 11 | |
| GSE74703 | LCN1 | 3933 | 3 | 5 | 28 | |
| GSE74704 | LCN1 | 3933 | 2 | 5 | 13 | |
| TCGA | LCN1 | 3933 | 28 | 25 | 43 |
Total number of gains: 70; Total number of losses: 96; Total Number of normals: 322.
Somatic mutations of LCN1:
Generating mutation plots.
Highly correlated genes for LCN1:
Showing top 20/123 corelated genes with mean PCC>0.5.
| Gene1 | Gene2 | Mean PCC | Num. Datasets | Num. PCC<0 | Num. PCC>0.5 |
|---|---|---|---|---|---|
| LCN1 | PRH2 | 0.854892 | 3 | 0 | 3 |
| LCN1 | CACNA1H | 0.726892 | 3 | 0 | 3 |
| LCN1 | PIP | 0.723401 | 6 | 0 | 6 |
| LCN1 | PLIN4 | 0.721236 | 3 | 0 | 3 |
| LCN1 | SCGB3A1 | 0.705019 | 5 | 0 | 5 |
| LCN1 | MUC7 | 0.69356 | 7 | 0 | 5 |
| LCN1 | DCDC2B | 0.689946 | 3 | 0 | 3 |
| LCN1 | STATH | 0.686223 | 8 | 0 | 7 |
| LCN1 | IGH | 0.684514 | 3 | 0 | 3 |
| LCN1 | NOS3 | 0.681136 | 3 | 0 | 3 |
| LCN1 | ZNF483 | 0.678271 | 3 | 0 | 3 |
| LCN1 | SGCA | 0.675566 | 3 | 0 | 3 |
| LCN1 | S1PR5 | 0.672846 | 3 | 0 | 3 |
| LCN1 | BCAS4 | 0.667911 | 3 | 0 | 3 |
| LCN1 | SCGB2A2 | 0.667824 | 6 | 0 | 5 |
| LCN1 | NPHS1 | 0.663386 | 3 | 0 | 3 |
| LCN1 | MAG | 0.662194 | 3 | 0 | 3 |
| LCN1 | GDF2 | 0.661611 | 3 | 0 | 3 |
| LCN1 | CPLX3 | 0.661107 | 3 | 0 | 3 |
| LCN1 | SSPO | 0.659968 | 3 | 0 | 3 |
For details and further investigation, click here