| Full name: sphingosine-1-phosphate receptor 5 | Alias Symbol: Edg-8 | ||
| Type: protein-coding gene | Cytoband: 19p13.2 | ||
| Entrez ID: 53637 | HGNC ID: HGNC:14299 | Ensembl Gene: ENSG00000180739 | OMIM ID: 605146 |
| Related drugs: AMISELIMOD HYDROCHLORIDE, FINGOLIMOD HYDROCHLORIDE, Siponimod... [more] | |||
S1PR5 involved pathways:
| KEGG pathway | Description | View |
|---|---|---|
| hsa04071 | Sphingolipid signaling pathway |
Expression of S1PR5:
| Dataset | Gene | EntrezID | Probe | Log2FC | Adj.pValue | Expression |
|---|---|---|---|---|---|---|
| GSE17351 | S1PR5 | 53637 | 230464_at | 0.5878 | 0.3436 | |
| GSE20347 | S1PR5 | 53637 | 221417_x_at | 0.0435 | 0.5044 | |
| GSE23400 | S1PR5 | 53637 | 221417_x_at | 0.0646 | 0.0954 | |
| GSE26886 | S1PR5 | 53637 | 230464_at | -0.4220 | 0.1101 | |
| GSE29001 | S1PR5 | 53637 | 221417_x_at | 0.0098 | 0.9410 | |
| GSE38129 | S1PR5 | 53637 | 221417_x_at | 0.0924 | 0.1479 | |
| GSE45670 | S1PR5 | 53637 | 230464_at | 0.8883 | 0.0001 | |
| GSE53622 | S1PR5 | 53637 | 36714 | 0.8459 | 0.0002 | |
| GSE53624 | S1PR5 | 53637 | 36714 | 0.7218 | 0.0000 | |
| GSE63941 | S1PR5 | 53637 | 230464_at | 2.3141 | 0.0069 | |
| GSE77861 | S1PR5 | 53637 | 230464_at | 0.1417 | 0.6341 | |
| GSE97050 | S1PR5 | 53637 | A_23_P107744 | 0.2936 | 0.3692 | |
| SRP007169 | S1PR5 | 53637 | RNAseq | 1.0570 | 0.0232 | |
| SRP008496 | S1PR5 | 53637 | RNAseq | 0.9559 | 0.0070 | |
| SRP064894 | S1PR5 | 53637 | RNAseq | 0.8352 | 0.0128 | |
| SRP133303 | S1PR5 | 53637 | RNAseq | 0.3980 | 0.1597 | |
| SRP159526 | S1PR5 | 53637 | RNAseq | 0.4650 | 0.2146 | |
| SRP219564 | S1PR5 | 53637 | RNAseq | 0.1296 | 0.8825 | |
| TCGA | S1PR5 | 53637 | RNAseq | 1.9829 | 0.0000 |
Upregulated datasets: 3; Downregulated datasets: 0.
Survival by S1PR5 expression:
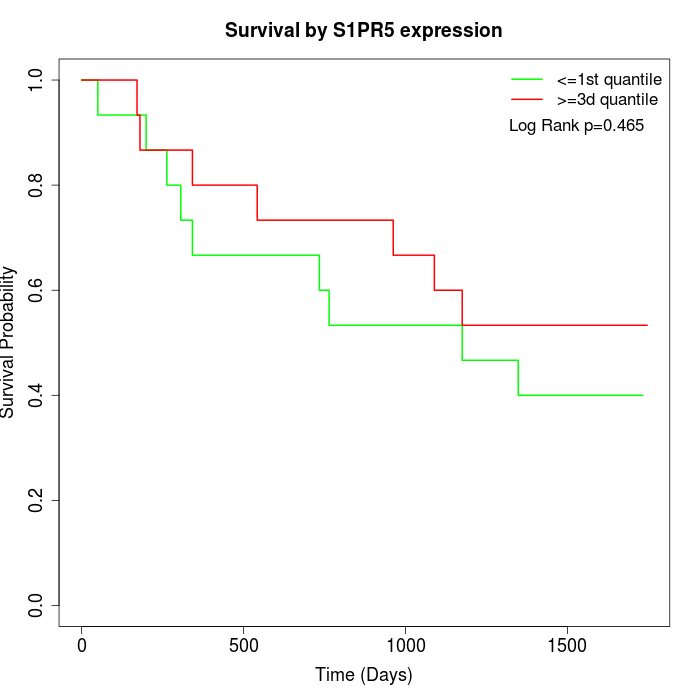 | 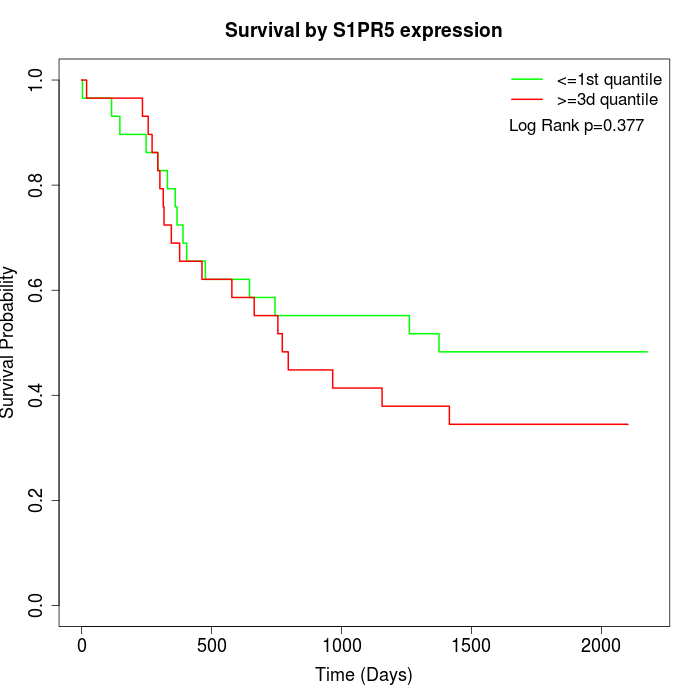 | 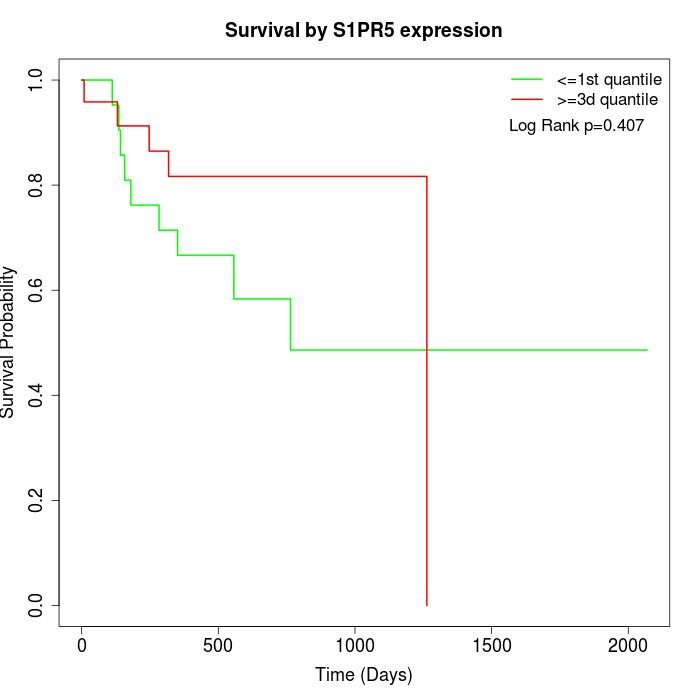 |
| GSE53622 | GSE53624 | TCGA |
Note: Click image to view full size file.
Copy number change of S1PR5:
| Dataset | Gene | EntrezID | Gain | Loss | Normal | Detail |
|---|---|---|---|---|---|---|
| GSE15526 | S1PR5 | 53637 | 4 | 3 | 23 | |
| GSE20123 | S1PR5 | 53637 | 3 | 1 | 26 | |
| GSE43470 | S1PR5 | 53637 | 3 | 6 | 34 | |
| GSE46452 | S1PR5 | 53637 | 47 | 1 | 11 | |
| GSE47630 | S1PR5 | 53637 | 4 | 7 | 29 | |
| GSE54993 | S1PR5 | 53637 | 16 | 3 | 51 | |
| GSE54994 | S1PR5 | 53637 | 7 | 13 | 33 | |
| GSE60625 | S1PR5 | 53637 | 9 | 0 | 2 | |
| GSE74703 | S1PR5 | 53637 | 3 | 4 | 29 | |
| GSE74704 | S1PR5 | 53637 | 0 | 1 | 19 | |
| TCGA | S1PR5 | 53637 | 15 | 14 | 67 |
Total number of gains: 111; Total number of losses: 53; Total Number of normals: 324.
Somatic mutations of S1PR5:
Generating mutation plots.
Highly correlated genes for S1PR5:
Showing top 20/559 corelated genes with mean PCC>0.5.
| Gene1 | Gene2 | Mean PCC | Num. Datasets | Num. PCC<0 | Num. PCC>0.5 |
|---|---|---|---|---|---|
| S1PR5 | COPE | 0.768041 | 3 | 0 | 3 |
| S1PR5 | NUDT21 | 0.75901 | 3 | 0 | 3 |
| S1PR5 | E2F8 | 0.750917 | 3 | 0 | 3 |
| S1PR5 | TRAF3 | 0.749843 | 3 | 0 | 3 |
| S1PR5 | LSM4 | 0.742989 | 3 | 0 | 3 |
| S1PR5 | MRPL21 | 0.731515 | 3 | 0 | 3 |
| S1PR5 | TNFAIP1 | 0.729671 | 3 | 0 | 3 |
| S1PR5 | IFFO2 | 0.725638 | 3 | 0 | 3 |
| S1PR5 | TUFM | 0.721519 | 3 | 0 | 3 |
| S1PR5 | RAB12 | 0.720611 | 3 | 0 | 3 |
| S1PR5 | CHMP1B | 0.719524 | 3 | 0 | 3 |
| S1PR5 | FAM32A | 0.71524 | 3 | 0 | 3 |
| S1PR5 | SNX12 | 0.714941 | 3 | 0 | 3 |
| S1PR5 | WDR77 | 0.710521 | 4 | 0 | 4 |
| S1PR5 | EIF2A | 0.705653 | 3 | 0 | 3 |
| S1PR5 | TMEM54 | 0.704299 | 5 | 0 | 5 |
| S1PR5 | SPATS2 | 0.70203 | 3 | 0 | 3 |
| S1PR5 | TERF2 | 0.701037 | 3 | 0 | 3 |
| S1PR5 | CDK5R1 | 0.694751 | 4 | 0 | 3 |
| S1PR5 | NFKB2 | 0.693794 | 3 | 0 | 3 |
For details and further investigation, click here