| Full name: mitogen-activated protein kinase kinase kinase 10 | Alias Symbol: MST|MEKK10 | ||
| Type: protein-coding gene | Cytoband: 19q13.2 | ||
| Entrez ID: 4294 | HGNC ID: HGNC:6849 | Ensembl Gene: ENSG00000130758 | OMIM ID: 600137 |
| Related drugs: CEP-1347... [more] | |||
Expression of MAP3K10:
| Dataset | Gene | EntrezID | Probe | Log2FC | Adj.pValue | Expression |
|---|---|---|---|---|---|---|
| GSE17351 | MAP3K10 | 4294 | 206362_x_at | 0.0479 | 0.8496 | |
| GSE20347 | MAP3K10 | 4294 | 206362_x_at | -0.0647 | 0.4239 | |
| GSE23400 | MAP3K10 | 4294 | 206362_x_at | -0.1285 | 0.0047 | |
| GSE26886 | MAP3K10 | 4294 | 206362_x_at | 0.0114 | 0.9568 | |
| GSE29001 | MAP3K10 | 4294 | 206362_x_at | -0.2943 | 0.0205 | |
| GSE38129 | MAP3K10 | 4294 | 206362_x_at | -0.1917 | 0.0135 | |
| GSE45670 | MAP3K10 | 4294 | 206362_x_at | 0.1351 | 0.0982 | |
| GSE53622 | MAP3K10 | 4294 | 86112 | -0.4943 | 0.0000 | |
| GSE53624 | MAP3K10 | 4294 | 86112 | -0.7440 | 0.0000 | |
| GSE63941 | MAP3K10 | 4294 | 206362_x_at | 0.2463 | 0.0929 | |
| GSE77861 | MAP3K10 | 4294 | 206362_x_at | 0.0286 | 0.8221 | |
| GSE97050 | MAP3K10 | 4294 | A_24_P284523 | -0.2456 | 0.2994 | |
| SRP007169 | MAP3K10 | 4294 | RNAseq | 0.3436 | 0.4707 | |
| SRP008496 | MAP3K10 | 4294 | RNAseq | 0.3896 | 0.2568 | |
| SRP064894 | MAP3K10 | 4294 | RNAseq | 1.2496 | 0.0000 | |
| SRP133303 | MAP3K10 | 4294 | RNAseq | 0.6213 | 0.0004 | |
| SRP159526 | MAP3K10 | 4294 | RNAseq | 0.9768 | 0.0002 | |
| SRP193095 | MAP3K10 | 4294 | RNAseq | 0.9254 | 0.0000 | |
| SRP219564 | MAP3K10 | 4294 | RNAseq | 0.4509 | 0.2568 | |
| TCGA | MAP3K10 | 4294 | RNAseq | -0.0097 | 0.8614 |
Upregulated datasets: 1; Downregulated datasets: 0.
Survival by MAP3K10 expression:
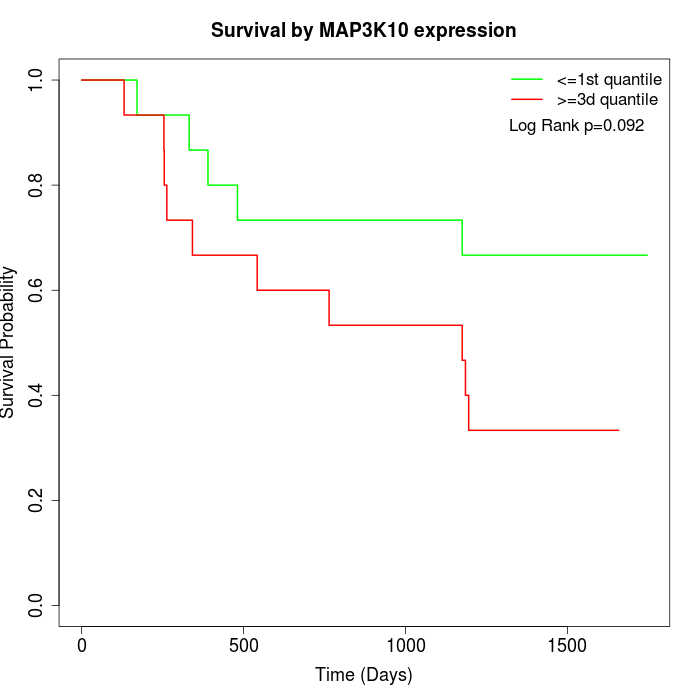 | 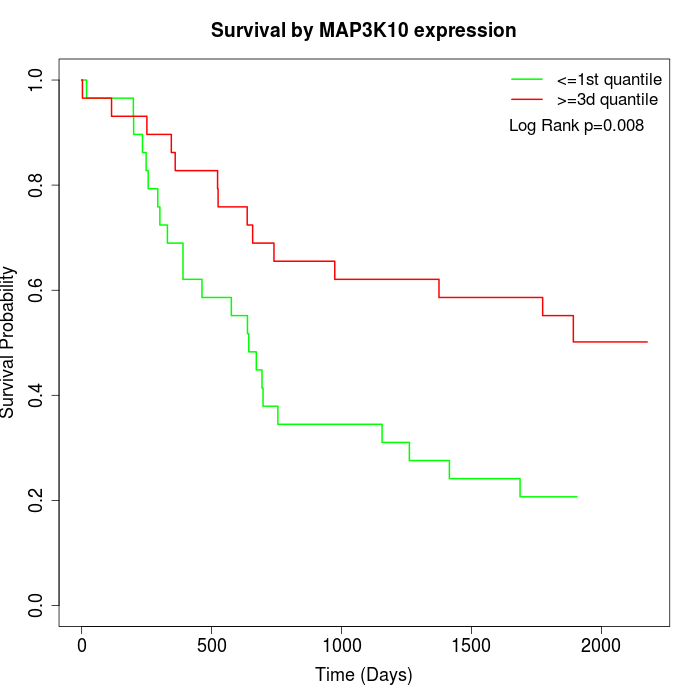 | 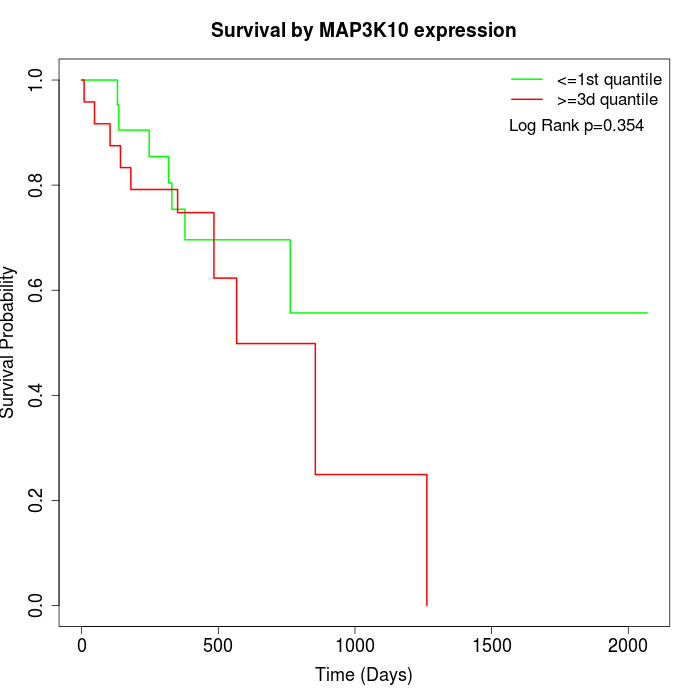 |
| GSE53622 | GSE53624 | TCGA |
Note: Click image to view full size file.
Copy number change of MAP3K10:
| Dataset | Gene | EntrezID | Gain | Loss | Normal | Detail |
|---|---|---|---|---|---|---|
| GSE15526 | MAP3K10 | 4294 | 6 | 5 | 19 | |
| GSE20123 | MAP3K10 | 4294 | 6 | 4 | 20 | |
| GSE43470 | MAP3K10 | 4294 | 3 | 9 | 31 | |
| GSE46452 | MAP3K10 | 4294 | 48 | 1 | 10 | |
| GSE47630 | MAP3K10 | 4294 | 9 | 5 | 26 | |
| GSE54993 | MAP3K10 | 4294 | 17 | 3 | 50 | |
| GSE54994 | MAP3K10 | 4294 | 8 | 9 | 36 | |
| GSE60625 | MAP3K10 | 4294 | 9 | 0 | 2 | |
| GSE74703 | MAP3K10 | 4294 | 3 | 6 | 27 | |
| GSE74704 | MAP3K10 | 4294 | 6 | 2 | 12 | |
| TCGA | MAP3K10 | 4294 | 14 | 16 | 66 |
Total number of gains: 129; Total number of losses: 60; Total Number of normals: 299.
Somatic mutations of MAP3K10:
Generating mutation plots.
Highly correlated genes for MAP3K10:
Showing top 20/1217 corelated genes with mean PCC>0.5.
| Gene1 | Gene2 | Mean PCC | Num. Datasets | Num. PCC<0 | Num. PCC>0.5 |
|---|---|---|---|---|---|
| MAP3K10 | LRCH4 | 0.877315 | 3 | 0 | 3 |
| MAP3K10 | KRTAP6-1 | 0.857684 | 3 | 0 | 3 |
| MAP3K10 | C11orf86 | 0.851948 | 3 | 0 | 3 |
| MAP3K10 | MFSD2B | 0.837052 | 3 | 0 | 3 |
| MAP3K10 | OR2Z1 | 0.827505 | 3 | 0 | 3 |
| MAP3K10 | OR13G1 | 0.824431 | 3 | 0 | 3 |
| MAP3K10 | KRTAP20-1 | 0.816863 | 3 | 0 | 3 |
| MAP3K10 | BARHL2 | 0.804237 | 3 | 0 | 3 |
| MAP3K10 | OR10G8 | 0.785994 | 3 | 0 | 3 |
| MAP3K10 | TPRX1 | 0.7792 | 3 | 0 | 3 |
| MAP3K10 | GDF7 | 0.776363 | 3 | 0 | 3 |
| MAP3K10 | TDGF1 | 0.773465 | 3 | 0 | 3 |
| MAP3K10 | CD164L2 | 0.773446 | 3 | 0 | 3 |
| MAP3K10 | TEN1 | 0.772421 | 3 | 0 | 3 |
| MAP3K10 | BPIFB4 | 0.769438 | 3 | 0 | 3 |
| MAP3K10 | CELF5 | 0.764596 | 3 | 0 | 3 |
| MAP3K10 | FAM71A | 0.755083 | 4 | 0 | 4 |
| MAP3K10 | OR51T1 | 0.753512 | 3 | 0 | 3 |
| MAP3K10 | IGFN1 | 0.753083 | 4 | 0 | 4 |
| MAP3K10 | CLDN24 | 0.752312 | 3 | 0 | 3 |
For details and further investigation, click here