| Full name: myosin light chain 10 | Alias Symbol: MGC3479|MYLC2PL|PLRLC | ||
| Type: protein-coding gene | Cytoband: 7q22.1 | ||
| Entrez ID: 93408 | HGNC ID: HGNC:29825 | Ensembl Gene: ENSG00000106436 | OMIM ID: 617177 |
MYL10 involved pathways:
| KEGG pathway | Description | View |
|---|---|---|
| hsa04510 | Focal adhesion | |
| hsa04530 | Tight junction | |
| hsa04670 | Leukocyte transendothelial migration | |
| hsa04810 | Regulation of actin cytoskeleton |
Expression of MYL10:
| Dataset | Gene | EntrezID | Probe | Log2FC | Adj.pValue | Expression |
|---|---|---|---|---|---|---|
| GSE17351 | MYL10 | 93408 | 221660_at | 0.0142 | 0.9687 | |
| GSE20347 | MYL10 | 93408 | 221660_at | -0.0771 | 0.4144 | |
| GSE23400 | MYL10 | 93408 | 221660_at | -0.0530 | 0.1638 | |
| GSE26886 | MYL10 | 93408 | 221660_at | 0.0191 | 0.9204 | |
| GSE29001 | MYL10 | 93408 | 221660_at | -0.2659 | 0.0982 | |
| GSE38129 | MYL10 | 93408 | 221660_at | -0.1232 | 0.2383 | |
| GSE45670 | MYL10 | 93408 | 221660_at | -0.1020 | 0.2599 | |
| GSE53622 | MYL10 | 93408 | 93806 | 0.0315 | 0.8343 | |
| GSE53624 | MYL10 | 93408 | 93806 | -0.1025 | 0.2643 | |
| GSE63941 | MYL10 | 93408 | 221660_at | 0.0557 | 0.6625 | |
| GSE77861 | MYL10 | 93408 | 221660_at | 0.0023 | 0.9903 | |
| GSE97050 | MYL10 | 93408 | A_33_P3369098 | -1.0252 | 0.3326 | |
| SRP133303 | MYL10 | 93408 | RNAseq | -0.0081 | 0.9726 |
Upregulated datasets: 0; Downregulated datasets: 0.
Survival by MYL10 expression:
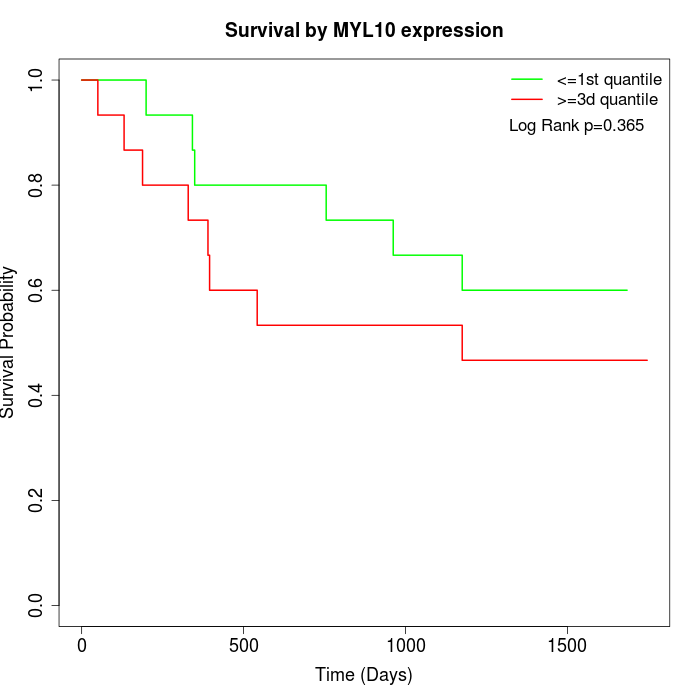 | 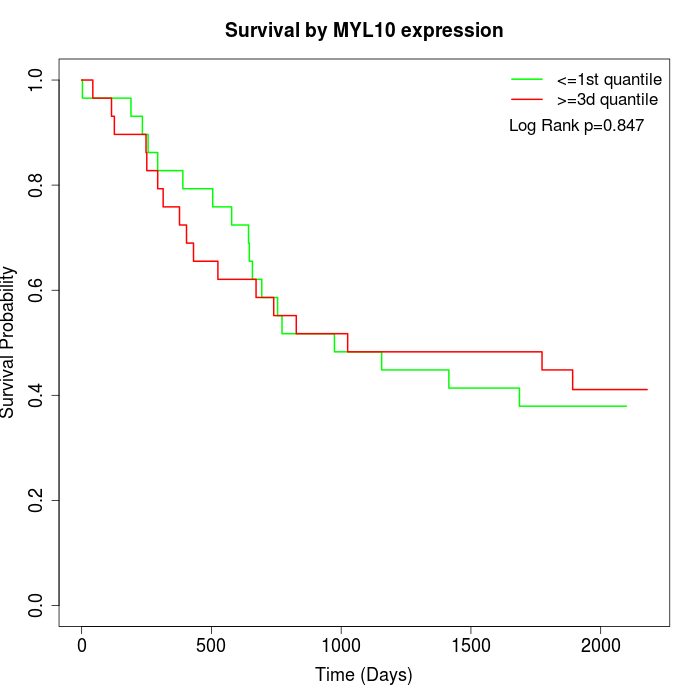 | 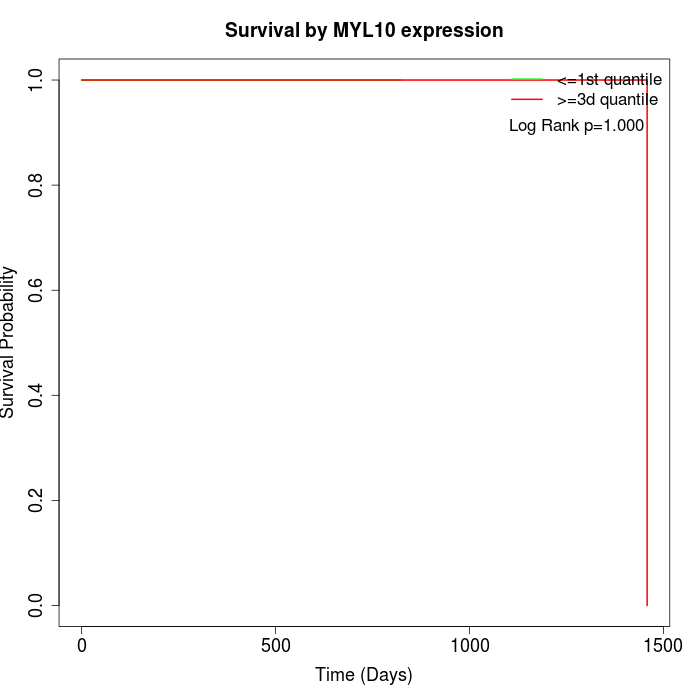 |
| GSE53622 | GSE53624 | TCGA |
Note: Click image to view full size file.
Copy number change of MYL10:
| Dataset | Gene | EntrezID | Gain | Loss | Normal | Detail |
|---|---|---|---|---|---|---|
| GSE15526 | MYL10 | 93408 | 14 | 0 | 16 | |
| GSE20123 | MYL10 | 93408 | 14 | 0 | 16 | |
| GSE43470 | MYL10 | 93408 | 7 | 2 | 34 | |
| GSE46452 | MYL10 | 93408 | 10 | 1 | 48 | |
| GSE47630 | MYL10 | 93408 | 7 | 3 | 30 | |
| GSE54993 | MYL10 | 93408 | 1 | 10 | 59 | |
| GSE54994 | MYL10 | 93408 | 15 | 3 | 35 | |
| GSE60625 | MYL10 | 93408 | 0 | 0 | 11 | |
| GSE74703 | MYL10 | 93408 | 7 | 1 | 28 | |
| GSE74704 | MYL10 | 93408 | 10 | 0 | 10 | |
| TCGA | MYL10 | 93408 | 53 | 6 | 37 |
Total number of gains: 138; Total number of losses: 26; Total Number of normals: 324.
Somatic mutations of MYL10:
Generating mutation plots.
Highly correlated genes for MYL10:
Showing top 20/229 corelated genes with mean PCC>0.5.
| Gene1 | Gene2 | Mean PCC | Num. Datasets | Num. PCC<0 | Num. PCC>0.5 |
|---|---|---|---|---|---|
| MYL10 | FBXL19-AS1 | 0.703649 | 3 | 0 | 3 |
| MYL10 | COL26A1 | 0.675786 | 3 | 0 | 3 |
| MYL10 | RPUSD1 | 0.670756 | 3 | 0 | 3 |
| MYL10 | IL34 | 0.669775 | 4 | 0 | 4 |
| MYL10 | ZSCAN10 | 0.652746 | 3 | 0 | 3 |
| MYL10 | BAZ2A | 0.649494 | 4 | 0 | 3 |
| MYL10 | NFAM1 | 0.649479 | 4 | 0 | 4 |
| MYL10 | SEMA6C | 0.647608 | 10 | 0 | 8 |
| MYL10 | ITPKB-IT1 | 0.647547 | 4 | 0 | 3 |
| MYL10 | SCUBE1 | 0.640508 | 3 | 0 | 3 |
| MYL10 | CELF3 | 0.634612 | 8 | 0 | 8 |
| MYL10 | DLG4 | 0.626552 | 6 | 0 | 5 |
| MYL10 | SYP | 0.625168 | 3 | 0 | 3 |
| MYL10 | NPAS4 | 0.622228 | 3 | 0 | 3 |
| MYL10 | SIK1 | 0.621065 | 4 | 0 | 4 |
| MYL10 | TMEM255B | 0.620858 | 3 | 0 | 3 |
| MYL10 | MYOG | 0.616278 | 8 | 0 | 5 |
| MYL10 | SLC38A3 | 0.616158 | 5 | 0 | 5 |
| MYL10 | DUX1 | 0.616157 | 9 | 0 | 6 |
| MYL10 | PURB | 0.613051 | 4 | 0 | 3 |
For details and further investigation, click here