| Full name: NBPF member 3 | Alias Symbol: AE2 | ||
| Type: protein-coding gene | Cytoband: 1p36.12 | ||
| Entrez ID: 84224 | HGNC ID: HGNC:25076 | Ensembl Gene: ENSG00000142794 | OMIM ID: 612992 |
Expression of NBPF3:
| Dataset | Gene | EntrezID | Probe | Log2FC | Adj.pValue | Expression |
|---|---|---|---|---|---|---|
| GSE17351 | NBPF3 | 84224 | 223638_at | 0.1407 | 0.8450 | |
| GSE26886 | NBPF3 | 84224 | 223638_at | -0.2161 | 0.2785 | |
| GSE45670 | NBPF3 | 84224 | 223638_at | 0.3373 | 0.0621 | |
| GSE53622 | NBPF3 | 84224 | 62837 | 0.2311 | 0.0099 | |
| GSE53624 | NBPF3 | 84224 | 62837 | -0.0916 | 0.4674 | |
| GSE63941 | NBPF3 | 84224 | 223638_at | -1.4371 | 0.0135 | |
| GSE77861 | NBPF3 | 84224 | 223638_at | 0.0394 | 0.9216 | |
| GSE97050 | NBPF3 | 84224 | A_32_P88635 | -0.0283 | 0.9240 | |
| SRP007169 | NBPF3 | 84224 | RNAseq | 0.5839 | 0.2717 | |
| SRP008496 | NBPF3 | 84224 | RNAseq | 0.6585 | 0.0639 | |
| SRP064894 | NBPF3 | 84224 | RNAseq | 0.0400 | 0.8766 | |
| SRP133303 | NBPF3 | 84224 | RNAseq | 0.2847 | 0.3286 | |
| SRP159526 | NBPF3 | 84224 | RNAseq | 0.5695 | 0.2000 | |
| SRP193095 | NBPF3 | 84224 | RNAseq | 0.3842 | 0.0065 | |
| SRP219564 | NBPF3 | 84224 | RNAseq | 0.3045 | 0.4230 | |
| TCGA | NBPF3 | 84224 | RNAseq | -0.2650 | 0.0509 |
Upregulated datasets: 0; Downregulated datasets: 1.
Survival by NBPF3 expression:
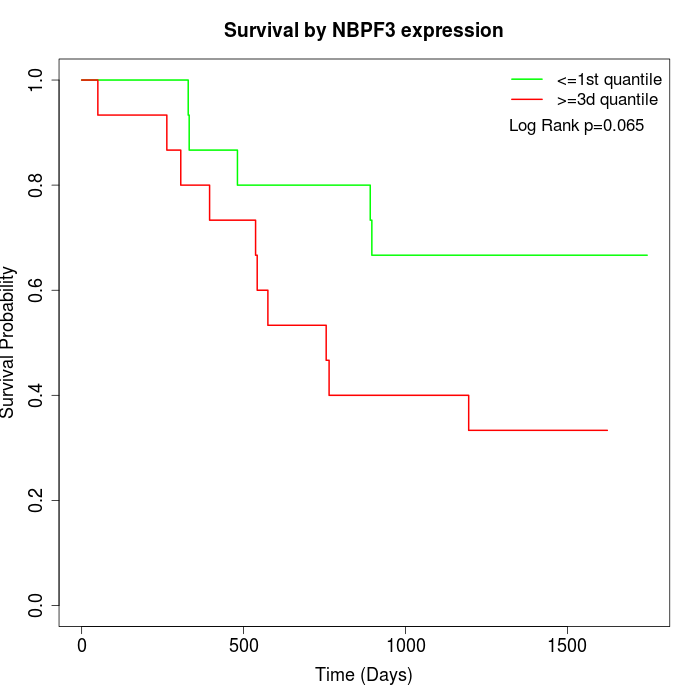 | 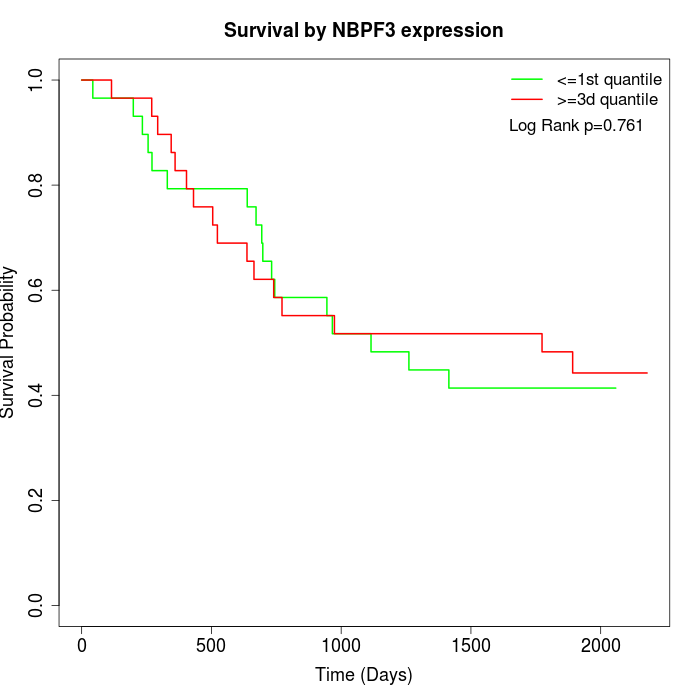 | 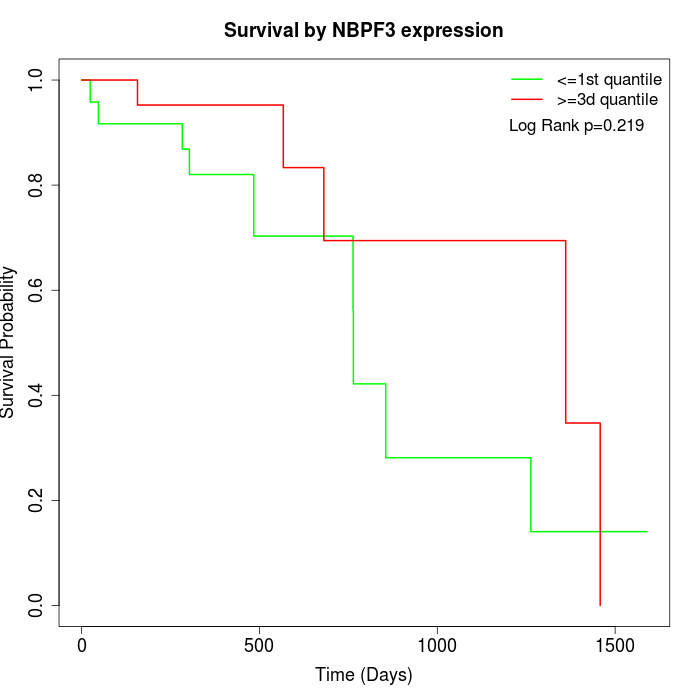 |
| GSE53622 | GSE53624 | TCGA |
Note: Click image to view full size file.
Copy number change of NBPF3:
| Dataset | Gene | EntrezID | Gain | Loss | Normal | Detail |
|---|---|---|---|---|---|---|
| GSE15526 | NBPF3 | 84224 | 0 | 5 | 25 | |
| GSE20123 | NBPF3 | 84224 | 0 | 4 | 26 | |
| GSE43470 | NBPF3 | 84224 | 2 | 6 | 35 | |
| GSE46452 | NBPF3 | 84224 | 5 | 1 | 53 | |
| GSE47630 | NBPF3 | 84224 | 8 | 3 | 29 | |
| GSE54993 | NBPF3 | 84224 | 3 | 1 | 66 | |
| GSE54994 | NBPF3 | 84224 | 11 | 4 | 38 | |
| GSE60625 | NBPF3 | 84224 | 0 | 0 | 11 | |
| GSE74703 | NBPF3 | 84224 | 1 | 4 | 31 | |
| GSE74704 | NBPF3 | 84224 | 0 | 0 | 20 | |
| TCGA | NBPF3 | 84224 | 9 | 23 | 64 |
Total number of gains: 39; Total number of losses: 51; Total Number of normals: 398.
Somatic mutations of NBPF3:
Generating mutation plots.
Highly correlated genes for NBPF3:
Showing top 20/112 corelated genes with mean PCC>0.5.
| Gene1 | Gene2 | Mean PCC | Num. Datasets | Num. PCC<0 | Num. PCC>0.5 |
|---|---|---|---|---|---|
| NBPF3 | SLC26A1 | 0.75022 | 3 | 0 | 3 |
| NBPF3 | ZNF843 | 0.746194 | 3 | 0 | 3 |
| NBPF3 | KRTAP10-12 | 0.74591 | 3 | 0 | 3 |
| NBPF3 | ZNF667 | 0.735697 | 3 | 0 | 3 |
| NBPF3 | SYCN | 0.725383 | 3 | 0 | 3 |
| NBPF3 | RXFP3 | 0.718663 | 3 | 0 | 3 |
| NBPF3 | SLC52A1 | 0.718005 | 3 | 0 | 3 |
| NBPF3 | TCTE1 | 0.716294 | 3 | 0 | 3 |
| NBPF3 | RAB44 | 0.715552 | 3 | 0 | 3 |
| NBPF3 | SERPINA10 | 0.714947 | 3 | 0 | 3 |
| NBPF3 | PLA2G2C | 0.712543 | 3 | 0 | 3 |
| NBPF3 | DCDC1 | 0.708573 | 3 | 0 | 3 |
| NBPF3 | OR2T27 | 0.708238 | 3 | 0 | 3 |
| NBPF3 | FOXA3 | 0.695919 | 3 | 0 | 3 |
| NBPF3 | SLC39A5 | 0.694577 | 3 | 0 | 3 |
| NBPF3 | CA6 | 0.692716 | 3 | 0 | 3 |
| NBPF3 | YY2 | 0.69035 | 3 | 0 | 3 |
| NBPF3 | PTAFR | 0.688927 | 3 | 0 | 3 |
| NBPF3 | STRC | 0.684245 | 3 | 0 | 3 |
| NBPF3 | SLC22A31 | 0.683529 | 3 | 0 | 3 |
For details and further investigation, click here