| Full name: neuronal calcium sensor 1 | Alias Symbol: NCS-1 | ||
| Type: protein-coding gene | Cytoband: 9q34.11 | ||
| Entrez ID: 23413 | HGNC ID: HGNC:3953 | Ensembl Gene: ENSG00000107130 | OMIM ID: 603315 |
Expression of NCS1:
| Dataset | Gene | EntrezID | Probe | Log2FC | Adj.pValue | Expression |
|---|---|---|---|---|---|---|
| GSE17351 | NCS1 | 23413 | 238753_at | 0.1180 | 0.5802 | |
| GSE20347 | NCS1 | 23413 | 218266_s_at | -0.0487 | 0.8167 | |
| GSE23400 | NCS1 | 23413 | 218266_s_at | -0.2026 | 0.0000 | |
| GSE26886 | NCS1 | 23413 | 238753_at | 0.1353 | 0.3833 | |
| GSE29001 | NCS1 | 23413 | 218266_s_at | 0.0740 | 0.6689 | |
| GSE38129 | NCS1 | 23413 | 218266_s_at | -0.1175 | 0.4944 | |
| GSE45670 | NCS1 | 23413 | 238753_at | 0.1122 | 0.3112 | |
| GSE53622 | NCS1 | 23413 | 26118 | -0.1687 | 0.2953 | |
| GSE53624 | NCS1 | 23413 | 26118 | 0.3171 | 0.0042 | |
| GSE63941 | NCS1 | 23413 | 238753_at | -0.5850 | 0.0417 | |
| GSE77861 | NCS1 | 23413 | 238753_at | 0.0979 | 0.5277 | |
| GSE97050 | NCS1 | 23413 | A_33_P3275350 | -0.8641 | 0.1857 | |
| SRP007169 | NCS1 | 23413 | RNAseq | 1.5097 | 0.0069 | |
| SRP008496 | NCS1 | 23413 | RNAseq | 1.7566 | 0.0000 | |
| SRP064894 | NCS1 | 23413 | RNAseq | 0.7178 | 0.0130 | |
| SRP133303 | NCS1 | 23413 | RNAseq | 0.2966 | 0.3473 | |
| SRP159526 | NCS1 | 23413 | RNAseq | -0.1999 | 0.5618 | |
| SRP193095 | NCS1 | 23413 | RNAseq | 1.0728 | 0.0000 | |
| SRP219564 | NCS1 | 23413 | RNAseq | -0.4956 | 0.5693 | |
| TCGA | NCS1 | 23413 | RNAseq | 0.0533 | 0.5789 |
Upregulated datasets: 3; Downregulated datasets: 0.
Survival by NCS1 expression:
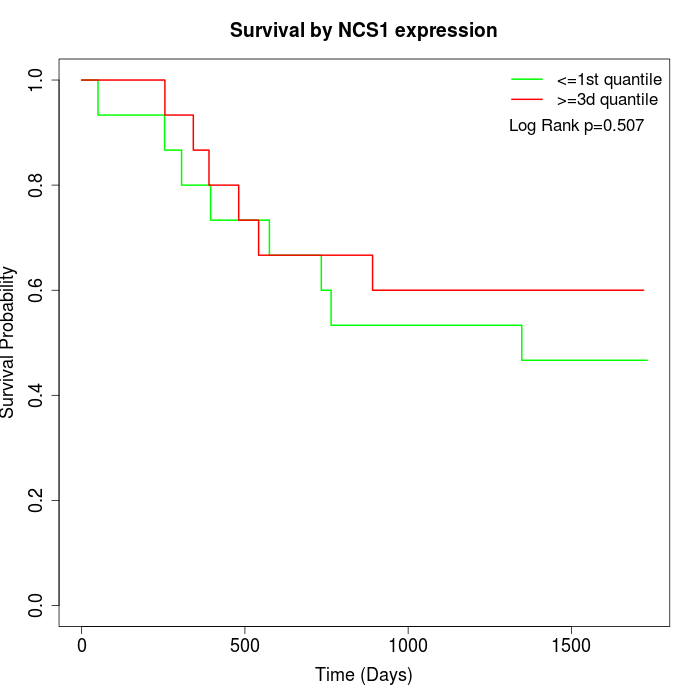 | 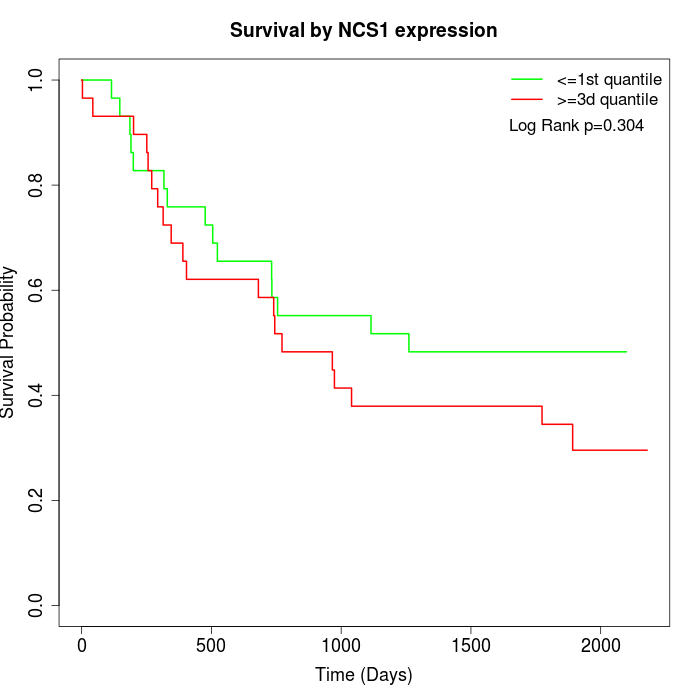 | 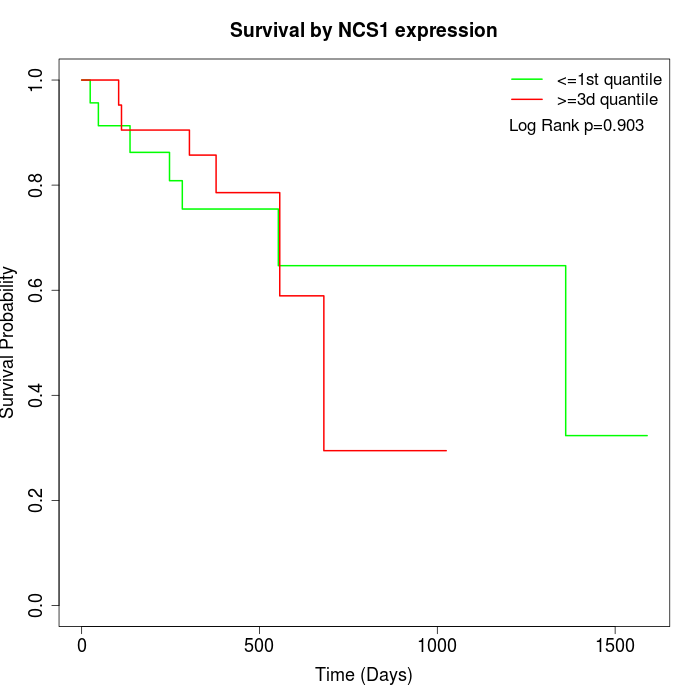 |
| GSE53622 | GSE53624 | TCGA |
Note: Click image to view full size file.
Copy number change of NCS1:
| Dataset | Gene | EntrezID | Gain | Loss | Normal | Detail |
|---|---|---|---|---|---|---|
| GSE15526 | NCS1 | 23413 | 6 | 9 | 15 | |
| GSE20123 | NCS1 | 23413 | 6 | 9 | 15 | |
| GSE43470 | NCS1 | 23413 | 5 | 7 | 31 | |
| GSE46452 | NCS1 | 23413 | 6 | 13 | 40 | |
| GSE47630 | NCS1 | 23413 | 3 | 16 | 21 | |
| GSE54993 | NCS1 | 23413 | 3 | 3 | 64 | |
| GSE54994 | NCS1 | 23413 | 12 | 9 | 32 | |
| GSE60625 | NCS1 | 23413 | 0 | 0 | 11 | |
| GSE74703 | NCS1 | 23413 | 5 | 5 | 26 | |
| GSE74704 | NCS1 | 23413 | 3 | 7 | 10 | |
| TCGA | NCS1 | 23413 | 27 | 26 | 43 |
Total number of gains: 76; Total number of losses: 104; Total Number of normals: 308.
Somatic mutations of NCS1:
Generating mutation plots.
Highly correlated genes for NCS1:
Showing top 20/223 corelated genes with mean PCC>0.5.
| Gene1 | Gene2 | Mean PCC | Num. Datasets | Num. PCC<0 | Num. PCC>0.5 |
|---|---|---|---|---|---|
| NCS1 | KCTD10 | 0.775399 | 3 | 0 | 3 |
| NCS1 | TTBK2 | 0.755844 | 3 | 0 | 3 |
| NCS1 | NUTF2 | 0.748984 | 3 | 0 | 3 |
| NCS1 | MYADM | 0.737436 | 3 | 0 | 3 |
| NCS1 | PAK2 | 0.721477 | 3 | 0 | 3 |
| NCS1 | STK32B | 0.717578 | 3 | 0 | 3 |
| NCS1 | CERCAM | 0.706093 | 3 | 0 | 3 |
| NCS1 | POPDC2 | 0.702383 | 3 | 0 | 3 |
| NCS1 | MRAS | 0.699422 | 3 | 0 | 3 |
| NCS1 | ARHGEF25 | 0.698822 | 3 | 0 | 3 |
| NCS1 | RASD2 | 0.69493 | 3 | 0 | 3 |
| NCS1 | ANO6 | 0.681229 | 4 | 0 | 4 |
| NCS1 | GLS | 0.681026 | 3 | 0 | 3 |
| NCS1 | ZC3H12C | 0.680949 | 3 | 0 | 3 |
| NCS1 | BVES | 0.67842 | 4 | 0 | 3 |
| NCS1 | ZC3H7B | 0.678349 | 4 | 0 | 3 |
| NCS1 | ASB5 | 0.677163 | 3 | 0 | 3 |
| NCS1 | CLMP | 0.676979 | 4 | 0 | 4 |
| NCS1 | C5orf24 | 0.665674 | 3 | 0 | 3 |
| NCS1 | FIBCD1 | 0.664202 | 3 | 0 | 3 |
For details and further investigation, click here