| Full name: glutaminase | Alias Symbol: KIAA0838|GLS1 | ||
| Type: protein-coding gene | Cytoband: 2q32.2 | ||
| Entrez ID: 2744 | HGNC ID: HGNC:4331 | Ensembl Gene: ENSG00000115419 | OMIM ID: 138280 |
| Related drugs: 6-DIAZO-5-OXO-L-NORLEUCINE, DEXAMETHASONE, GLUTAMINE, METHOTREXATE... [more] | |||
Screen Evidence:
| |||
Expression of GLS:
| Dataset | Gene | EntrezID | Probe | Log2FC | Adj.pValue | Expression |
|---|---|---|---|---|---|---|
| GSE17351 | GLS | 2744 | 221510_s_at | 1.3721 | 0.0823 | |
| GSE20347 | GLS | 2744 | 221510_s_at | 1.3911 | 0.0000 | |
| GSE23400 | GLS | 2744 | 203159_at | 0.1013 | 0.3522 | |
| GSE26886 | GLS | 2744 | 203159_at | 0.2985 | 0.3290 | |
| GSE29001 | GLS | 2744 | 203159_at | 0.3075 | 0.3642 | |
| GSE38129 | GLS | 2744 | 221510_s_at | 1.3056 | 0.0000 | |
| GSE45670 | GLS | 2744 | 221510_s_at | 0.7575 | 0.0236 | |
| GSE53622 | GLS | 2744 | 72025 | 0.3250 | 0.0024 | |
| GSE53624 | GLS | 2744 | 72025 | 0.4883 | 0.0000 | |
| GSE63941 | GLS | 2744 | 221510_s_at | -1.9094 | 0.0108 | |
| GSE77861 | GLS | 2744 | 221510_s_at | 1.4430 | 0.0072 | |
| GSE97050 | GLS | 2744 | A_33_P3379916 | 0.0597 | 0.9089 | |
| SRP007169 | GLS | 2744 | RNAseq | 2.2189 | 0.0000 | |
| SRP008496 | GLS | 2744 | RNAseq | 2.0467 | 0.0000 | |
| SRP064894 | GLS | 2744 | RNAseq | 1.0507 | 0.0004 | |
| SRP133303 | GLS | 2744 | RNAseq | 1.4869 | 0.0000 | |
| SRP159526 | GLS | 2744 | RNAseq | 0.2532 | 0.1715 | |
| SRP193095 | GLS | 2744 | RNAseq | 0.8760 | 0.0000 | |
| SRP219564 | GLS | 2744 | RNAseq | 0.6193 | 0.1499 | |
| TCGA | GLS | 2744 | RNAseq | 0.2147 | 0.0027 |
Upregulated datasets: 7; Downregulated datasets: 1.
Survival by GLS expression:
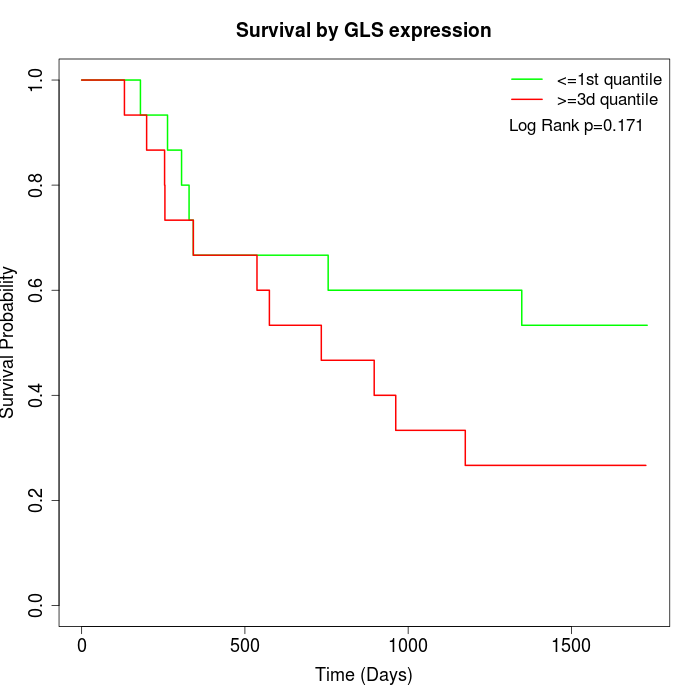 | 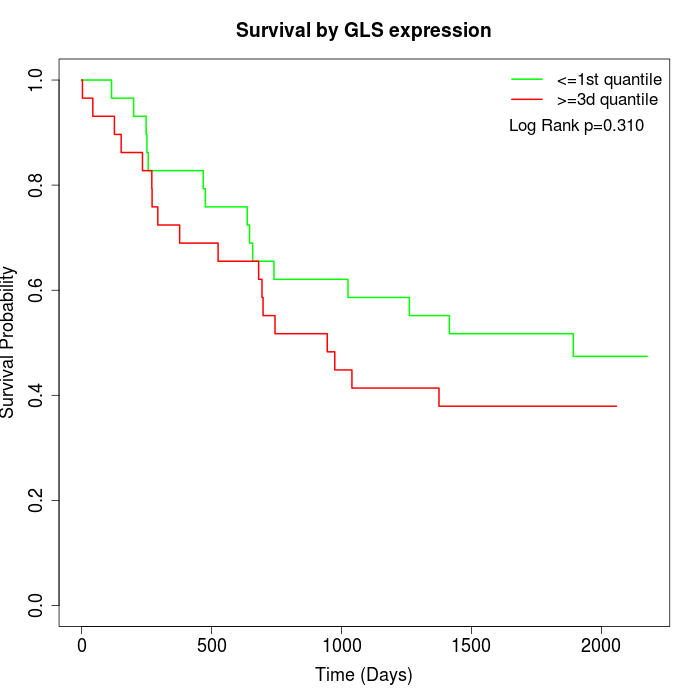 | 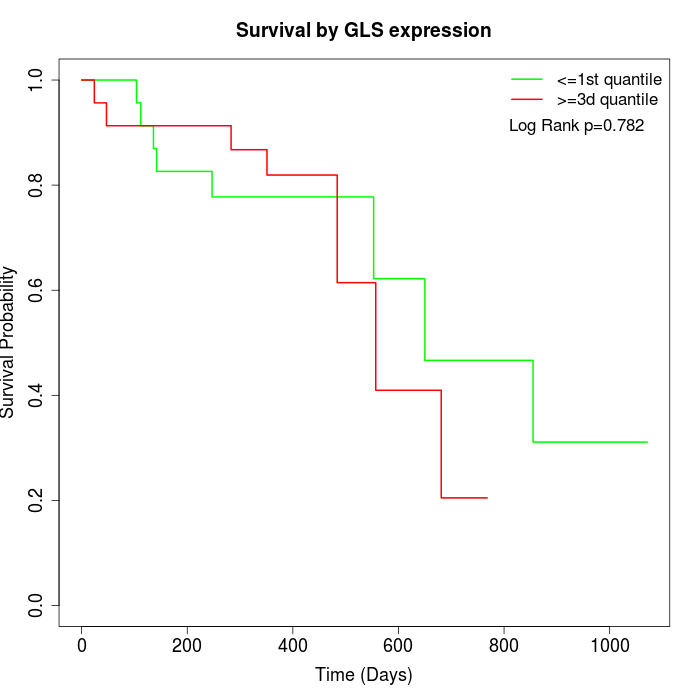 |
| GSE53622 | GSE53624 | TCGA |
Note: Click image to view full size file.
Copy number change of GLS:
| Dataset | Gene | EntrezID | Gain | Loss | Normal | Detail |
|---|---|---|---|---|---|---|
| GSE15526 | GLS | 2744 | 8 | 2 | 20 | |
| GSE20123 | GLS | 2744 | 8 | 2 | 20 | |
| GSE43470 | GLS | 2744 | 3 | 1 | 39 | |
| GSE46452 | GLS | 2744 | 1 | 4 | 54 | |
| GSE47630 | GLS | 2744 | 4 | 5 | 31 | |
| GSE54993 | GLS | 2744 | 0 | 5 | 65 | |
| GSE54994 | GLS | 2744 | 12 | 6 | 35 | |
| GSE60625 | GLS | 2744 | 0 | 3 | 8 | |
| GSE74703 | GLS | 2744 | 2 | 1 | 33 | |
| GSE74704 | GLS | 2744 | 3 | 2 | 15 | |
| TCGA | GLS | 2744 | 24 | 8 | 64 |
Total number of gains: 65; Total number of losses: 39; Total Number of normals: 384.
Somatic mutations of GLS:
Generating mutation plots.
Highly correlated genes for GLS:
Showing top 20/1180 corelated genes with mean PCC>0.5.
| Gene1 | Gene2 | Mean PCC | Num. Datasets | Num. PCC<0 | Num. PCC>0.5 |
|---|---|---|---|---|---|
| GLS | MZT1 | 0.78389 | 4 | 0 | 4 |
| GLS | INPP5E | 0.783829 | 3 | 0 | 3 |
| GLS | ZC3H7B | 0.781977 | 3 | 0 | 3 |
| GLS | ANLN | 0.781771 | 4 | 0 | 4 |
| GLS | TMX3 | 0.772119 | 3 | 0 | 3 |
| GLS | LRP6 | 0.766073 | 3 | 0 | 3 |
| GLS | TMEM138 | 0.761915 | 4 | 0 | 4 |
| GLS | VPS37A | 0.761804 | 3 | 0 | 3 |
| GLS | B3GALNT2 | 0.751468 | 3 | 0 | 3 |
| GLS | NSMCE2 | 0.751118 | 3 | 0 | 3 |
| GLS | MED13 | 0.750039 | 3 | 0 | 3 |
| GLS | PLEKHM3 | 0.742951 | 3 | 0 | 3 |
| GLS | PFDN2 | 0.740031 | 7 | 0 | 6 |
| GLS | DNAH14 | 0.735258 | 5 | 0 | 5 |
| GLS | SFT2D3 | 0.734939 | 3 | 0 | 3 |
| GLS | FUBP1 | 0.732595 | 4 | 0 | 4 |
| GLS | TRADD | 0.731706 | 3 | 0 | 3 |
| GLS | ANKIB1 | 0.731088 | 3 | 0 | 3 |
| GLS | C16orf87 | 0.730543 | 3 | 0 | 3 |
| GLS | PGAP1 | 0.730329 | 3 | 0 | 3 |
For details and further investigation, click here