| Full name: RASD family member 2 | Alias Symbol: TEM2|Rhes|MGC:4834 | ||
| Type: protein-coding gene | Cytoband: 22q12.3 | ||
| Entrez ID: 23551 | HGNC ID: HGNC:18229 | Ensembl Gene: ENSG00000100302 | OMIM ID: 612842 |
Expression of RASD2:
| Dataset | Gene | EntrezID | Probe | Log2FC | Adj.pValue | Expression |
|---|---|---|---|---|---|---|
| GSE17351 | RASD2 | 23551 | 223634_at | -0.3583 | 0.7559 | |
| GSE26886 | RASD2 | 23551 | 223634_at | 0.2901 | 0.2057 | |
| GSE45670 | RASD2 | 23551 | 223634_at | 0.0038 | 0.9813 | |
| GSE53622 | RASD2 | 23551 | 44430 | 0.4769 | 0.0412 | |
| GSE53624 | RASD2 | 23551 | 44430 | 0.8467 | 0.0000 | |
| GSE63941 | RASD2 | 23551 | 223634_at | 0.0338 | 0.9145 | |
| GSE77861 | RASD2 | 23551 | 223634_at | 0.1027 | 0.6125 | |
| GSE97050 | RASD2 | 23551 | A_24_P357100 | -1.1244 | 0.2332 | |
| SRP064894 | RASD2 | 23551 | RNAseq | 3.0653 | 0.0000 | |
| SRP133303 | RASD2 | 23551 | RNAseq | 1.0772 | 0.0816 | |
| SRP159526 | RASD2 | 23551 | RNAseq | 0.9861 | 0.0757 | |
| SRP219564 | RASD2 | 23551 | RNAseq | 0.4736 | 0.6772 | |
| TCGA | RASD2 | 23551 | RNAseq | 0.2745 | 0.1977 |
Upregulated datasets: 1; Downregulated datasets: 0.
Survival by RASD2 expression:
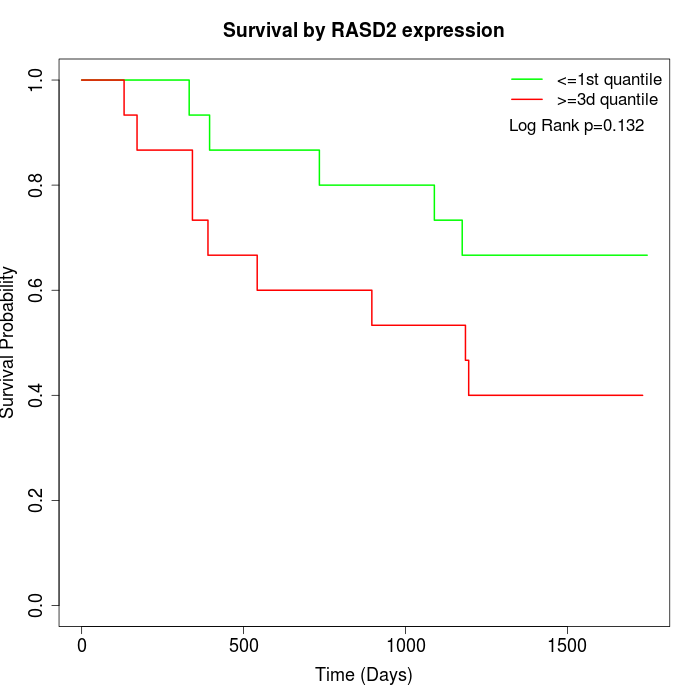 | 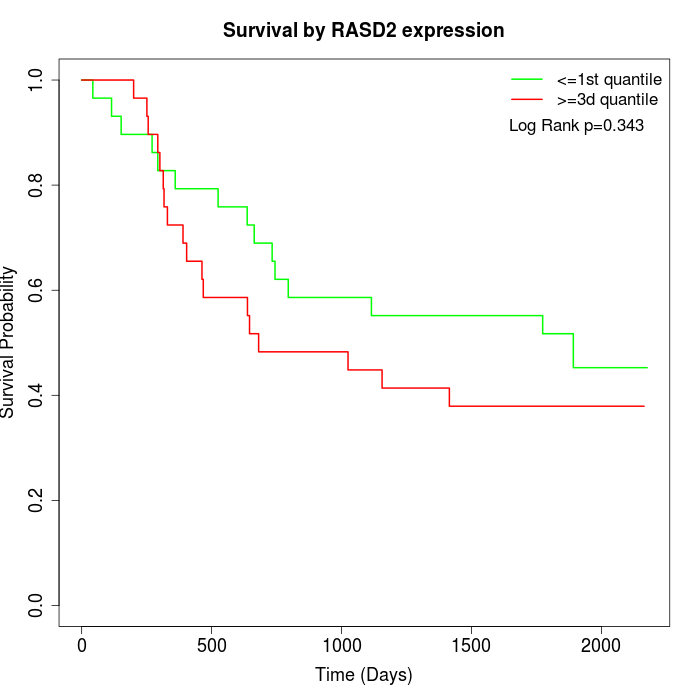 | 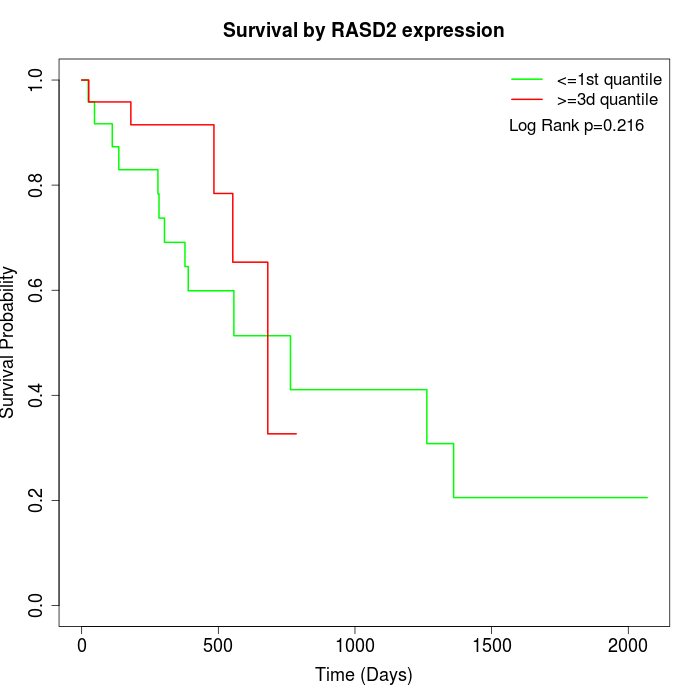 |
| GSE53622 | GSE53624 | TCGA |
Note: Click image to view full size file.
Copy number change of RASD2:
| Dataset | Gene | EntrezID | Gain | Loss | Normal | Detail |
|---|---|---|---|---|---|---|
| GSE15526 | RASD2 | 23551 | 4 | 6 | 20 | |
| GSE20123 | RASD2 | 23551 | 4 | 5 | 21 | |
| GSE43470 | RASD2 | 23551 | 4 | 7 | 32 | |
| GSE46452 | RASD2 | 23551 | 31 | 1 | 27 | |
| GSE47630 | RASD2 | 23551 | 8 | 5 | 27 | |
| GSE54993 | RASD2 | 23551 | 3 | 6 | 61 | |
| GSE54994 | RASD2 | 23551 | 9 | 9 | 35 | |
| GSE60625 | RASD2 | 23551 | 5 | 0 | 6 | |
| GSE74703 | RASD2 | 23551 | 4 | 5 | 27 | |
| GSE74704 | RASD2 | 23551 | 1 | 2 | 17 | |
| TCGA | RASD2 | 23551 | 27 | 15 | 54 |
Total number of gains: 100; Total number of losses: 61; Total Number of normals: 327.
Somatic mutations of RASD2:
Generating mutation plots.
Highly correlated genes for RASD2:
Showing top 20/398 corelated genes with mean PCC>0.5.
| Gene1 | Gene2 | Mean PCC | Num. Datasets | Num. PCC<0 | Num. PCC>0.5 |
|---|---|---|---|---|---|
| RASD2 | XKR4 | 0.880587 | 3 | 0 | 3 |
| RASD2 | PLEKHB1 | 0.79964 | 3 | 0 | 3 |
| RASD2 | FNDC5 | 0.79789 | 3 | 0 | 3 |
| RASD2 | NME5 | 0.792618 | 3 | 0 | 3 |
| RASD2 | RNASE4 | 0.770006 | 3 | 0 | 3 |
| RASD2 | FUNDC2 | 0.769186 | 3 | 0 | 3 |
| RASD2 | CACNA1C | 0.765981 | 3 | 0 | 3 |
| RASD2 | DIP2C | 0.765449 | 3 | 0 | 3 |
| RASD2 | CTXN1 | 0.762451 | 3 | 0 | 3 |
| RASD2 | PAMR1 | 0.759438 | 3 | 0 | 3 |
| RASD2 | LRRTM1 | 0.759123 | 3 | 0 | 3 |
| RASD2 | KCNT2 | 0.752877 | 4 | 0 | 3 |
| RASD2 | ERRFI1 | 0.742675 | 3 | 0 | 3 |
| RASD2 | APLP2 | 0.742204 | 3 | 0 | 3 |
| RASD2 | STXBP6 | 0.740082 | 3 | 0 | 3 |
| RASD2 | APOD | 0.740056 | 3 | 0 | 3 |
| RASD2 | ITIH5 | 0.732382 | 3 | 0 | 3 |
| RASD2 | EFHD1 | 0.732149 | 3 | 0 | 3 |
| RASD2 | SGCD | 0.731361 | 3 | 0 | 3 |
| RASD2 | TSC22D1 | 0.729811 | 3 | 0 | 3 |
For details and further investigation, click here