| Full name: pseudopodium enriched atypical kinase 1 | Alias Symbol: KIAA2002|sgk269 | ||
| Type: protein-coding gene | Cytoband: 15q24.3 | ||
| Entrez ID: 79834 | HGNC ID: HGNC:29431 | Ensembl Gene: ENSG00000173517 | OMIM ID: 614248 |
Expression of PEAK1:
| Dataset | Gene | EntrezID | Probe | Log2FC | Adj.pValue | Expression |
|---|---|---|---|---|---|---|
| GSE17351 | PEAK1 | 79834 | 225913_at | -0.3210 | 0.5815 | |
| GSE20347 | PEAK1 | 79834 | 220008_at | 0.1834 | 0.1378 | |
| GSE23400 | PEAK1 | 79834 | 220008_at | -0.0584 | 0.1406 | |
| GSE26886 | PEAK1 | 79834 | 225913_at | 0.4388 | 0.0665 | |
| GSE29001 | PEAK1 | 79834 | 220008_at | -0.0088 | 0.9685 | |
| GSE38129 | PEAK1 | 79834 | 220008_at | 0.0427 | 0.7452 | |
| GSE45670 | PEAK1 | 79834 | 225913_at | -0.3844 | 0.0472 | |
| GSE53622 | PEAK1 | 79834 | 71925 | 0.0041 | 0.9712 | |
| GSE53624 | PEAK1 | 79834 | 63539 | 0.1046 | 0.3089 | |
| GSE63941 | PEAK1 | 79834 | 225913_at | -2.8800 | 0.0000 | |
| GSE77861 | PEAK1 | 79834 | 220008_at | 0.0255 | 0.7821 | |
| GSE97050 | PEAK1 | A_21_P0008759 | -0.0320 | 0.8830 | ||
| SRP007169 | PEAK1 | 79834 | RNAseq | 1.9693 | 0.0000 | |
| SRP008496 | PEAK1 | 79834 | RNAseq | 2.0938 | 0.0000 | |
| SRP064894 | PEAK1 | 79834 | RNAseq | 0.5192 | 0.0748 | |
| SRP133303 | PEAK1 | 79834 | RNAseq | 0.1960 | 0.3732 | |
| SRP159526 | PEAK1 | 79834 | RNAseq | 0.2200 | 0.3614 | |
| SRP193095 | PEAK1 | 79834 | RNAseq | 0.3500 | 0.0327 | |
| SRP219564 | PEAK1 | 79834 | RNAseq | -0.2442 | 0.5104 |
Upregulated datasets: 2; Downregulated datasets: 1.
Survival by PEAK1 expression:
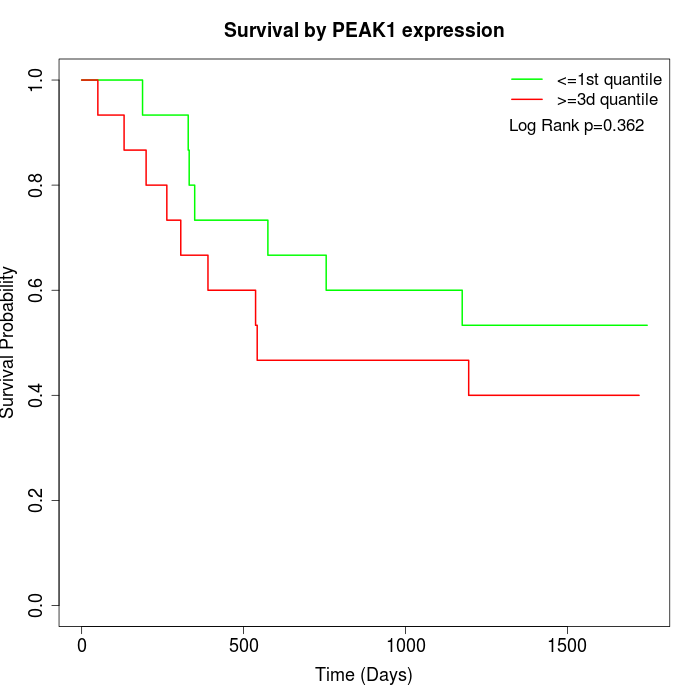 | 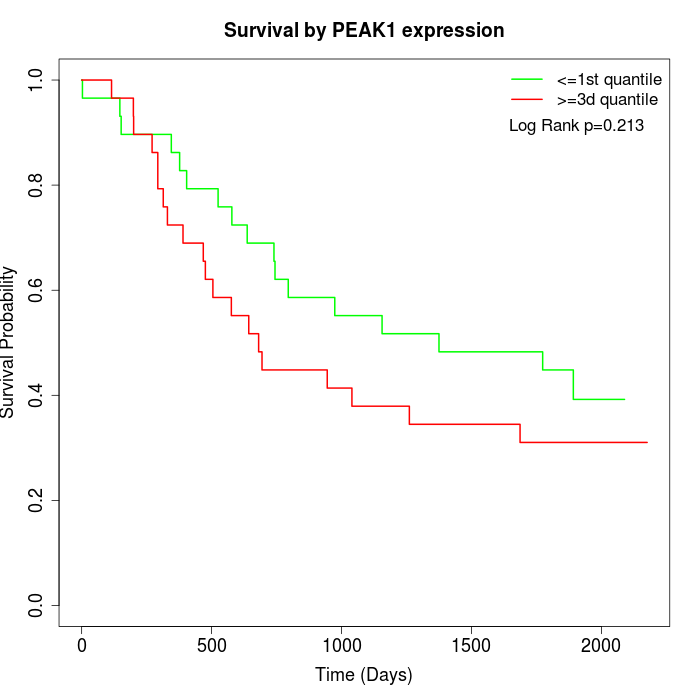 |
| GSE53622 | GSE53624 |
Note: Click image to view full size file.
Copy number change of PEAK1:
| Dataset | Gene | EntrezID | Gain | Loss | Normal | Detail |
|---|---|---|---|---|---|---|
| GSE15526 | PEAK1 | 79834 | 8 | 1 | 21 | |
| GSE20123 | PEAK1 | 79834 | 8 | 1 | 21 | |
| GSE43470 | PEAK1 | 79834 | 4 | 5 | 34 | |
| GSE46452 | PEAK1 | 79834 | 3 | 7 | 49 | |
| GSE47630 | PEAK1 | 79834 | 8 | 10 | 22 | |
| GSE54993 | PEAK1 | 79834 | 5 | 6 | 59 | |
| GSE54994 | PEAK1 | 79834 | 5 | 6 | 42 | |
| GSE60625 | PEAK1 | 79834 | 4 | 0 | 7 | |
| GSE74703 | PEAK1 | 79834 | 4 | 3 | 29 | |
| GSE74704 | PEAK1 | 79834 | 5 | 1 | 14 | |
| TCGA | PEAK1 | 79834 | 15 | 16 | 65 |
Total number of gains: 69; Total number of losses: 56; Total Number of normals: 363.
Somatic mutations of PEAK1:
Generating mutation plots.
Highly correlated genes for PEAK1:
Showing top 20/895 corelated genes with mean PCC>0.5.
| Gene1 | Gene2 | Mean PCC | Num. Datasets | Num. PCC<0 | Num. PCC>0.5 |
|---|---|---|---|---|---|
| PEAK1 | TCEAL7 | 0.77957 | 4 | 0 | 4 |
| PEAK1 | TNFRSF19 | 0.754082 | 3 | 0 | 3 |
| PEAK1 | SPATA9 | 0.741782 | 3 | 0 | 3 |
| PEAK1 | IL1RAPL2 | 0.740589 | 4 | 0 | 4 |
| PEAK1 | FOXN3-AS2 | 0.738389 | 5 | 0 | 4 |
| PEAK1 | KCTD7 | 0.73728 | 3 | 0 | 3 |
| PEAK1 | NTNG1 | 0.731479 | 4 | 0 | 4 |
| PEAK1 | ZNF423 | 0.729591 | 5 | 0 | 4 |
| PEAK1 | SYDE1 | 0.725543 | 7 | 0 | 6 |
| PEAK1 | SYT11 | 0.723926 | 7 | 0 | 6 |
| PEAK1 | UBE2Q2 | 0.717399 | 3 | 0 | 3 |
| PEAK1 | NAP1L3 | 0.717046 | 5 | 0 | 5 |
| PEAK1 | MCAM | 0.715884 | 6 | 0 | 5 |
| PEAK1 | FIBIN | 0.715471 | 5 | 0 | 4 |
| PEAK1 | C1orf54 | 0.715406 | 5 | 0 | 5 |
| PEAK1 | C20orf194 | 0.713031 | 3 | 0 | 3 |
| PEAK1 | STARD13 | 0.711848 | 7 | 0 | 7 |
| PEAK1 | FGFR1 | 0.710777 | 6 | 0 | 6 |
| PEAK1 | TNFSF8 | 0.710069 | 4 | 0 | 4 |
| PEAK1 | SLC39A13 | 0.705648 | 4 | 0 | 4 |
For details and further investigation, click here