| Full name: melanoma cell adhesion molecule | Alias Symbol: MUC18|CD146|MelCAM|METCAM|HEMCAM | ||
| Type: protein-coding gene | Cytoband: 11q23.3 | ||
| Entrez ID: 4162 | HGNC ID: HGNC:6934 | Ensembl Gene: ENSG00000076706 | OMIM ID: 155735 |
Expression of MCAM:
| Dataset | Gene | EntrezID | Probe | Log2FC | Adj.pValue | Expression |
|---|---|---|---|---|---|---|
| GSE17351 | MCAM | 4162 | 209087_x_at | -0.3086 | 0.7369 | |
| GSE20347 | MCAM | 4162 | 209087_x_at | 0.6367 | 0.0200 | |
| GSE23400 | MCAM | 4162 | 209087_x_at | -0.1935 | 0.2708 | |
| GSE26886 | MCAM | 4162 | 209087_x_at | 1.6491 | 0.0001 | |
| GSE29001 | MCAM | 4162 | 209087_x_at | 0.7788 | 0.0834 | |
| GSE38129 | MCAM | 4162 | 209087_x_at | -0.1520 | 0.7549 | |
| GSE45670 | MCAM | 4162 | 209087_x_at | -0.9320 | 0.0137 | |
| GSE63941 | MCAM | 4162 | 209087_x_at | -3.6926 | 0.0004 | |
| GSE77861 | MCAM | 4162 | 209087_x_at | 0.8181 | 0.0594 | |
| GSE97050 | MCAM | 4162 | A_23_P162171 | -0.7035 | 0.1356 | |
| SRP007169 | MCAM | 4162 | RNAseq | 2.6949 | 0.0000 | |
| SRP008496 | MCAM | 4162 | RNAseq | 2.5688 | 0.0000 | |
| SRP064894 | MCAM | 4162 | RNAseq | 0.2146 | 0.3409 | |
| SRP133303 | MCAM | 4162 | RNAseq | -0.3889 | 0.2554 | |
| SRP159526 | MCAM | 4162 | RNAseq | -0.5021 | 0.1729 | |
| SRP193095 | MCAM | 4162 | RNAseq | 2.0011 | 0.0000 | |
| SRP219564 | MCAM | 4162 | RNAseq | -0.4964 | 0.5654 | |
| TCGA | MCAM | 4162 | RNAseq | -0.2262 | 0.0117 |
Upregulated datasets: 4; Downregulated datasets: 1.
Survival by MCAM expression:
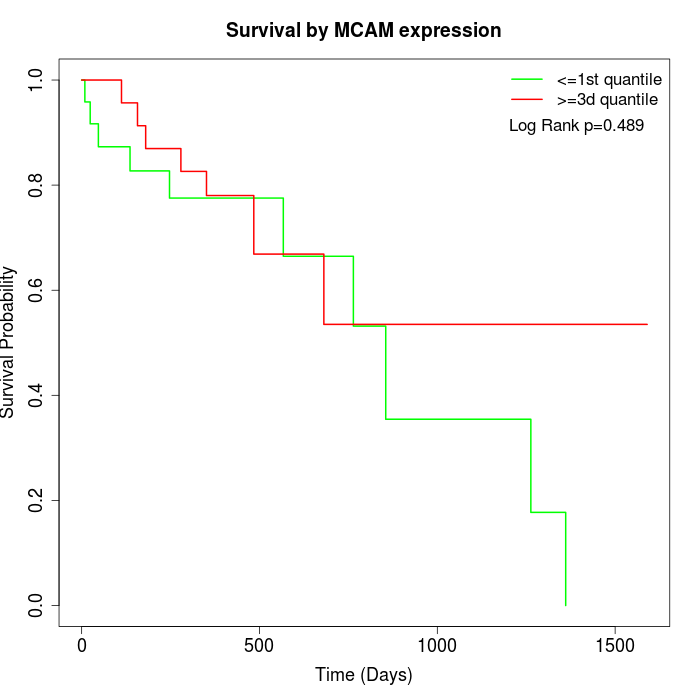 |
| TCGA |
Note: Click image to view full size file.
Copy number change of MCAM:
| Dataset | Gene | EntrezID | Gain | Loss | Normal | Detail |
|---|---|---|---|---|---|---|
| GSE15526 | MCAM | 4162 | 1 | 11 | 18 | |
| GSE20123 | MCAM | 4162 | 1 | 11 | 18 | |
| GSE43470 | MCAM | 4162 | 2 | 8 | 33 | |
| GSE46452 | MCAM | 4162 | 3 | 26 | 30 | |
| GSE47630 | MCAM | 4162 | 2 | 19 | 19 | |
| GSE54993 | MCAM | 4162 | 10 | 0 | 60 | |
| GSE54994 | MCAM | 4162 | 5 | 19 | 29 | |
| GSE60625 | MCAM | 4162 | 0 | 3 | 8 | |
| GSE74703 | MCAM | 4162 | 1 | 5 | 30 | |
| GSE74704 | MCAM | 4162 | 0 | 7 | 13 | |
| TCGA | MCAM | 4162 | 4 | 51 | 41 |
Total number of gains: 29; Total number of losses: 160; Total Number of normals: 299.
Somatic mutations of MCAM:
Generating mutation plots.
Highly correlated genes for MCAM:
Showing top 20/1410 corelated genes with mean PCC>0.5.
| Gene1 | Gene2 | Mean PCC | Num. Datasets | Num. PCC<0 | Num. PCC>0.5 |
|---|---|---|---|---|---|
| MCAM | LIX1L | 0.815242 | 6 | 0 | 6 |
| MCAM | MSRB3 | 0.811423 | 4 | 0 | 4 |
| MCAM | GLIPR2 | 0.802875 | 5 | 0 | 5 |
| MCAM | CLMP | 0.80172 | 5 | 0 | 4 |
| MCAM | PRKG1 | 0.800064 | 7 | 0 | 7 |
| MCAM | DOCK11 | 0.796112 | 6 | 0 | 6 |
| MCAM | PKIG | 0.792731 | 9 | 0 | 9 |
| MCAM | PLBD2 | 0.785903 | 3 | 0 | 3 |
| MCAM | TP53I13 | 0.784239 | 3 | 0 | 3 |
| MCAM | ANXA6 | 0.782749 | 9 | 0 | 9 |
| MCAM | MRGPRF | 0.778606 | 6 | 0 | 6 |
| MCAM | HMCN1 | 0.778461 | 6 | 0 | 6 |
| MCAM | SGCE | 0.776062 | 8 | 0 | 8 |
| MCAM | C11orf96 | 0.774665 | 5 | 0 | 4 |
| MCAM | CTHRC1 | 0.77213 | 3 | 0 | 3 |
| MCAM | PLEKHO1 | 0.770011 | 10 | 0 | 9 |
| MCAM | FLNA | 0.768129 | 9 | 0 | 9 |
| MCAM | EFEMP2 | 0.767578 | 10 | 0 | 9 |
| MCAM | UBE2Q2 | 0.766547 | 3 | 0 | 3 |
| MCAM | SLC25A30 | 0.766375 | 3 | 0 | 3 |
For details and further investigation, click here