| Full name: PHD finger protein 20 like 1 | Alias Symbol: CGI-72|FLJ13649|MGC64923|FLJ21615|TDRD20B | ||
| Type: protein-coding gene | Cytoband: 8q24.22 | ||
| Entrez ID: 51105 | HGNC ID: HGNC:24280 | Ensembl Gene: ENSG00000129292 | OMIM ID: |
Expression of PHF20L1:
| Dataset | Gene | EntrezID | Probe | Log2FC | Adj.pValue | Expression |
|---|---|---|---|---|---|---|
| GSE17351 | PHF20L1 | 51105 | 226942_at | 0.5609 | 0.0531 | |
| GSE20347 | PHF20L1 | 51105 | 222133_s_at | 0.7139 | 0.0001 | |
| GSE23400 | PHF20L1 | 51105 | 222133_s_at | 0.2393 | 0.0000 | |
| GSE26886 | PHF20L1 | 51105 | 226942_at | -0.4496 | 0.0584 | |
| GSE29001 | PHF20L1 | 51105 | 222133_s_at | 0.4304 | 0.3024 | |
| GSE38129 | PHF20L1 | 51105 | 222133_s_at | 0.6170 | 0.0006 | |
| GSE45670 | PHF20L1 | 51105 | 226942_at | 0.3170 | 0.0214 | |
| GSE53622 | PHF20L1 | 51105 | 33690 | 0.5245 | 0.0000 | |
| GSE53624 | PHF20L1 | 51105 | 33690 | 0.4814 | 0.0000 | |
| GSE63941 | PHF20L1 | 51105 | 226942_at | -1.4669 | 0.0150 | |
| GSE77861 | PHF20L1 | 51105 | 226942_at | 0.3005 | 0.0566 | |
| GSE97050 | PHF20L1 | 51105 | A_23_P216038 | 0.3141 | 0.4785 | |
| SRP007169 | PHF20L1 | 51105 | RNAseq | 0.3049 | 0.3851 | |
| SRP008496 | PHF20L1 | 51105 | RNAseq | 1.0420 | 0.0003 | |
| SRP064894 | PHF20L1 | 51105 | RNAseq | 0.4299 | 0.0147 | |
| SRP133303 | PHF20L1 | 51105 | RNAseq | 0.5957 | 0.0000 | |
| SRP159526 | PHF20L1 | 51105 | RNAseq | 0.1411 | 0.4745 | |
| SRP193095 | PHF20L1 | 51105 | RNAseq | 0.2841 | 0.0008 | |
| SRP219564 | PHF20L1 | 51105 | RNAseq | 0.4031 | 0.2881 | |
| TCGA | PHF20L1 | 51105 | RNAseq | 0.1214 | 0.0099 |
Upregulated datasets: 1; Downregulated datasets: 1.
Survival by PHF20L1 expression:
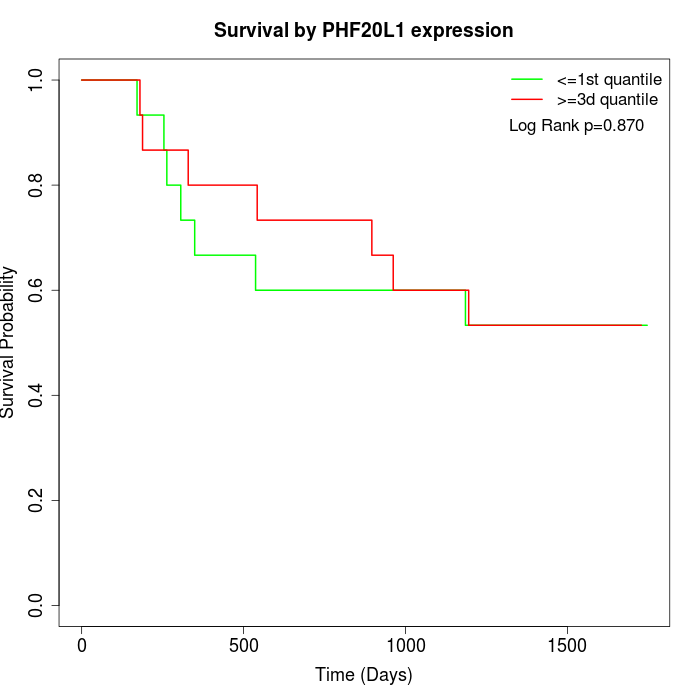 | 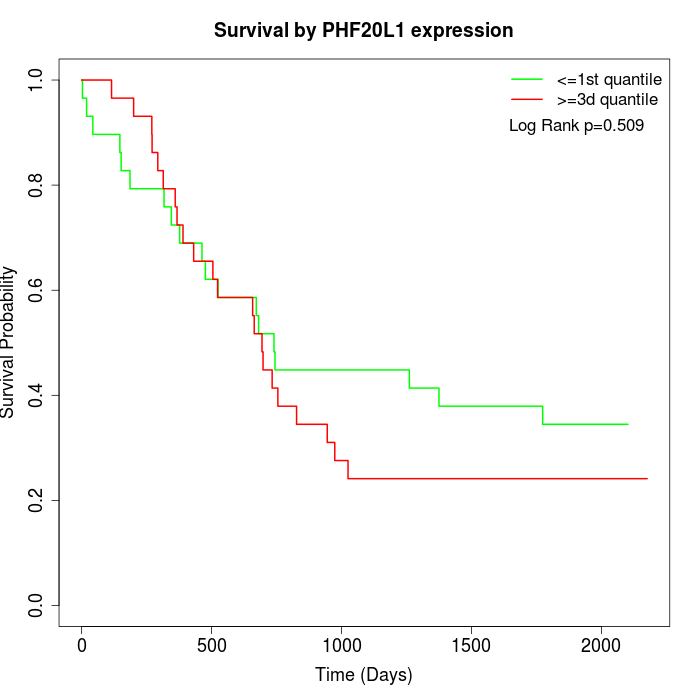 | 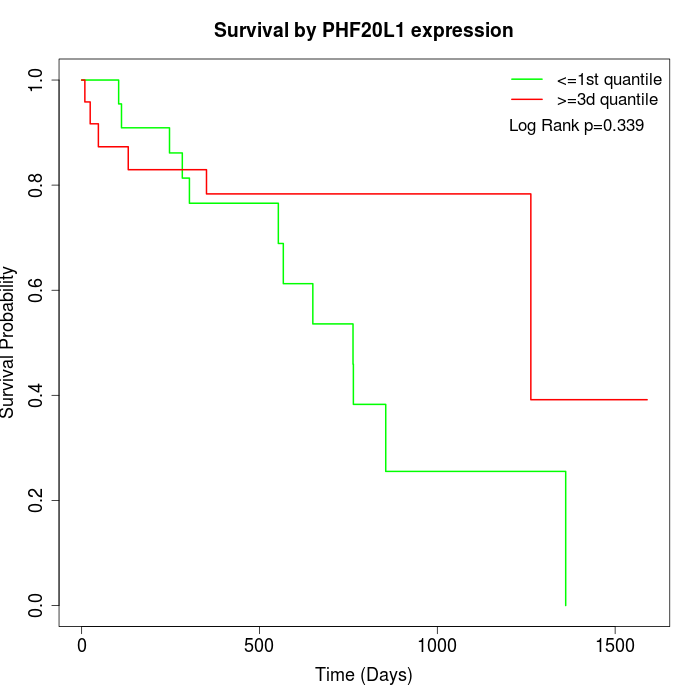 |
| GSE53622 | GSE53624 | TCGA |
Note: Click image to view full size file.
Copy number change of PHF20L1:
| Dataset | Gene | EntrezID | Gain | Loss | Normal | Detail |
|---|---|---|---|---|---|---|
| GSE15526 | PHF20L1 | 51105 | 18 | 0 | 12 | |
| GSE20123 | PHF20L1 | 51105 | 18 | 0 | 12 | |
| GSE43470 | PHF20L1 | 51105 | 23 | 1 | 19 | |
| GSE46452 | PHF20L1 | 51105 | 27 | 0 | 32 | |
| GSE47630 | PHF20L1 | 51105 | 24 | 0 | 16 | |
| GSE54993 | PHF20L1 | 51105 | 0 | 24 | 46 | |
| GSE54994 | PHF20L1 | 51105 | 39 | 1 | 13 | |
| GSE60625 | PHF20L1 | 51105 | 0 | 7 | 4 | |
| GSE74703 | PHF20L1 | 51105 | 20 | 0 | 16 | |
| GSE74704 | PHF20L1 | 51105 | 12 | 0 | 8 | |
| TCGA | PHF20L1 | 51105 | 66 | 2 | 28 |
Total number of gains: 247; Total number of losses: 35; Total Number of normals: 206.
Somatic mutations of PHF20L1:
Generating mutation plots.
Highly correlated genes for PHF20L1:
Showing top 20/313 corelated genes with mean PCC>0.5.
| Gene1 | Gene2 | Mean PCC | Num. Datasets | Num. PCC<0 | Num. PCC>0.5 |
|---|---|---|---|---|---|
| PHF20L1 | PIGG | 0.738547 | 3 | 0 | 3 |
| PHF20L1 | NUDCD1 | 0.688975 | 4 | 0 | 4 |
| PHF20L1 | TMEM177 | 0.681903 | 4 | 0 | 4 |
| PHF20L1 | SLC45A4 | 0.677615 | 4 | 0 | 3 |
| PHF20L1 | TAF2 | 0.677091 | 10 | 0 | 9 |
| PHF20L1 | PUF60 | 0.673843 | 8 | 0 | 7 |
| PHF20L1 | MTERF3 | 0.659608 | 7 | 0 | 7 |
| PHF20L1 | DCAF13 | 0.658 | 9 | 0 | 6 |
| PHF20L1 | TYW5 | 0.654849 | 3 | 0 | 3 |
| PHF20L1 | CLPTM1L | 0.649066 | 4 | 0 | 4 |
| PHF20L1 | ZNF148 | 0.647332 | 5 | 0 | 4 |
| PHF20L1 | LYAR | 0.646897 | 4 | 0 | 4 |
| PHF20L1 | G2E3 | 0.646699 | 6 | 0 | 5 |
| PHF20L1 | SLC25A32 | 0.646492 | 7 | 0 | 6 |
| PHF20L1 | INTS8 | 0.645388 | 8 | 0 | 8 |
| PHF20L1 | DDX55 | 0.644783 | 5 | 0 | 3 |
| PHF20L1 | WDR75 | 0.644657 | 4 | 0 | 3 |
| PHF20L1 | AGO2 | 0.643432 | 5 | 0 | 4 |
| PHF20L1 | STK3 | 0.643012 | 9 | 0 | 8 |
| PHF20L1 | DST | 0.640257 | 5 | 0 | 3 |
For details and further investigation, click here