| Full name: G2/M-phase specific E3 ubiquitin protein ligase | Alias Symbol: FLJ20333|PHF7B | ||
| Type: protein-coding gene | Cytoband: 14q12 | ||
| Entrez ID: 55632 | HGNC ID: HGNC:20338 | Ensembl Gene: ENSG00000092140 | OMIM ID: 611299 |
Expression of G2E3:
| Dataset | Gene | EntrezID | Probe | Log2FC | Adj.pValue | Expression |
|---|---|---|---|---|---|---|
| GSE17351 | G2E3 | 55632 | 223256_at | 1.1320 | 0.1517 | |
| GSE26886 | G2E3 | 55632 | 223254_s_at | 0.0170 | 0.9580 | |
| GSE45670 | G2E3 | 55632 | 223258_s_at | 0.6975 | 0.0012 | |
| GSE53622 | G2E3 | 55632 | 79686 | 0.9557 | 0.0000 | |
| GSE53624 | G2E3 | 55632 | 79686 | 1.0147 | 0.0000 | |
| GSE63941 | G2E3 | 55632 | 223256_at | 1.2391 | 0.0497 | |
| GSE77861 | G2E3 | 55632 | 223256_at | 0.6911 | 0.0998 | |
| GSE97050 | G2E3 | 55632 | A_23_P99604 | 0.3763 | 0.2433 | |
| SRP007169 | G2E3 | 55632 | RNAseq | 1.0101 | 0.0098 | |
| SRP008496 | G2E3 | 55632 | RNAseq | 1.0415 | 0.0000 | |
| SRP064894 | G2E3 | 55632 | RNAseq | 0.5982 | 0.0264 | |
| SRP133303 | G2E3 | 55632 | RNAseq | 1.1504 | 0.0000 | |
| SRP159526 | G2E3 | 55632 | RNAseq | 0.6401 | 0.0023 | |
| SRP193095 | G2E3 | 55632 | RNAseq | 0.4152 | 0.0029 | |
| SRP219564 | G2E3 | 55632 | RNAseq | 0.5273 | 0.2321 | |
| TCGA | G2E3 | 55632 | RNAseq | 0.2247 | 0.0003 |
Upregulated datasets: 5; Downregulated datasets: 0.
Survival by G2E3 expression:
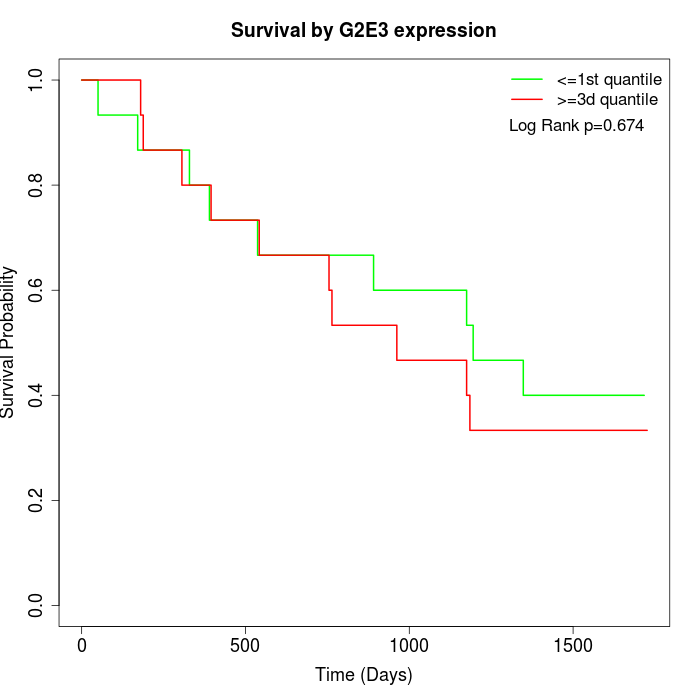 | 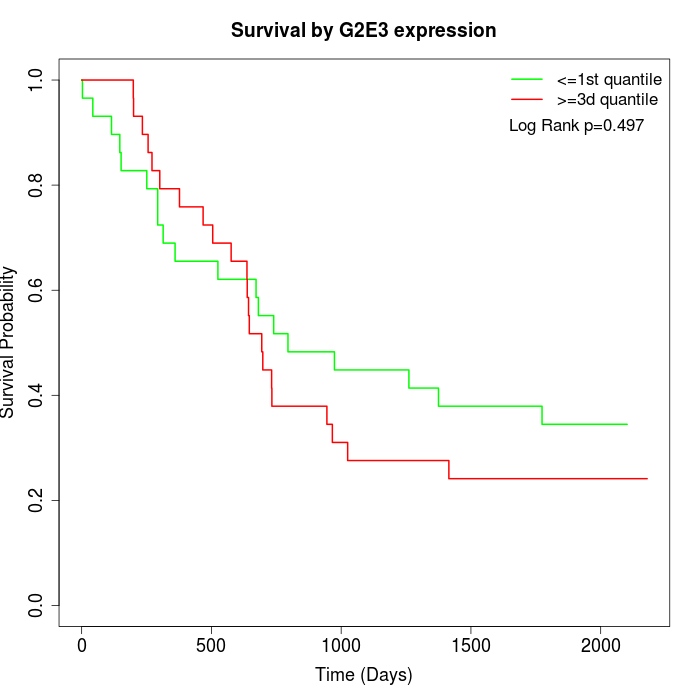 | 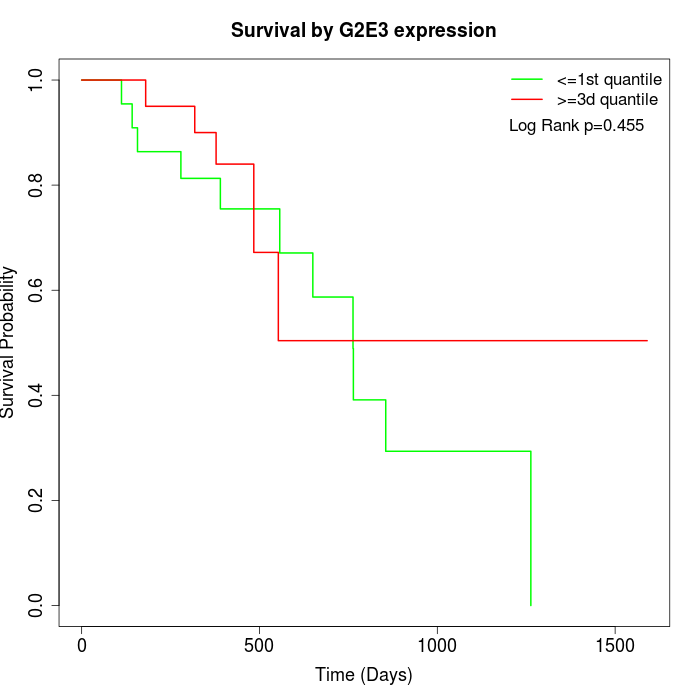 |
| GSE53622 | GSE53624 | TCGA |
Note: Click image to view full size file.
Copy number change of G2E3:
| Dataset | Gene | EntrezID | Gain | Loss | Normal | Detail |
|---|---|---|---|---|---|---|
| GSE15526 | G2E3 | 55632 | 9 | 4 | 17 | |
| GSE20123 | G2E3 | 55632 | 9 | 4 | 17 | |
| GSE43470 | G2E3 | 55632 | 10 | 2 | 31 | |
| GSE46452 | G2E3 | 55632 | 16 | 2 | 41 | |
| GSE47630 | G2E3 | 55632 | 11 | 10 | 19 | |
| GSE54993 | G2E3 | 55632 | 3 | 11 | 56 | |
| GSE54994 | G2E3 | 55632 | 19 | 5 | 29 | |
| GSE60625 | G2E3 | 55632 | 0 | 2 | 9 | |
| GSE74703 | G2E3 | 55632 | 9 | 2 | 25 | |
| GSE74704 | G2E3 | 55632 | 3 | 3 | 14 | |
| TCGA | G2E3 | 55632 | 31 | 14 | 51 |
Total number of gains: 120; Total number of losses: 59; Total Number of normals: 309.
Somatic mutations of G2E3:
Generating mutation plots.
Highly correlated genes for G2E3:
Showing top 20/1379 corelated genes with mean PCC>0.5.
| Gene1 | Gene2 | Mean PCC | Num. Datasets | Num. PCC<0 | Num. PCC>0.5 |
|---|---|---|---|---|---|
| G2E3 | RNMT | 0.817533 | 3 | 0 | 3 |
| G2E3 | SLC38A6 | 0.796084 | 4 | 0 | 4 |
| G2E3 | WDHD1 | 0.774252 | 7 | 0 | 7 |
| G2E3 | NEMF | 0.771523 | 3 | 0 | 3 |
| G2E3 | ESM1 | 0.756256 | 5 | 0 | 5 |
| G2E3 | RAD54L | 0.752252 | 4 | 0 | 4 |
| G2E3 | MIPOL1 | 0.751853 | 4 | 0 | 4 |
| G2E3 | KLHL28 | 0.75048 | 3 | 0 | 3 |
| G2E3 | DONSON | 0.749909 | 4 | 0 | 4 |
| G2E3 | MNAT1 | 0.749033 | 6 | 0 | 5 |
| G2E3 | ADSL | 0.748944 | 5 | 0 | 5 |
| G2E3 | CENPBD1 | 0.747618 | 3 | 0 | 3 |
| G2E3 | SUPT16H | 0.740973 | 7 | 0 | 6 |
| G2E3 | LRRC58 | 0.738598 | 4 | 0 | 3 |
| G2E3 | BAZ1A | 0.738121 | 7 | 0 | 7 |
| G2E3 | RACGAP1 | 0.737698 | 5 | 0 | 5 |
| G2E3 | XAB2 | 0.737279 | 3 | 0 | 3 |
| G2E3 | CDKN3 | 0.737041 | 7 | 0 | 7 |
| G2E3 | FZD6 | 0.736544 | 4 | 0 | 4 |
| G2E3 | C12orf43 | 0.735703 | 5 | 0 | 5 |
For details and further investigation, click here