| Full name: phosphotyrosine interaction domain containing 1 | Alias Symbol: NYGGF4|FLJ20701 | ||
| Type: protein-coding gene | Cytoband: 2q36.3 | ||
| Entrez ID: 55022 | HGNC ID: HGNC:26084 | Ensembl Gene: ENSG00000153823 | OMIM ID: 612930 |
Expression of PID1:
| Dataset | Gene | EntrezID | Probe | Log2FC | Adj.pValue | Expression |
|---|---|---|---|---|---|---|
| GSE17351 | PID1 | 55022 | 219093_at | -1.8830 | 0.1301 | |
| GSE20347 | PID1 | 55022 | 219093_at | -0.2949 | 0.0552 | |
| GSE23400 | PID1 | 55022 | 219093_at | -0.4057 | 0.0000 | |
| GSE26886 | PID1 | 55022 | 219093_at | -0.2134 | 0.6258 | |
| GSE29001 | PID1 | 55022 | 219093_at | -0.2794 | 0.5103 | |
| GSE38129 | PID1 | 55022 | 219093_at | -1.2176 | 0.0019 | |
| GSE45670 | PID1 | 55022 | 219093_at | -2.2491 | 0.0000 | |
| GSE53622 | PID1 | 55022 | 117278 | -1.4930 | 0.0000 | |
| GSE53624 | PID1 | 55022 | 117278 | -1.6057 | 0.0000 | |
| GSE63941 | PID1 | 55022 | 219093_at | -4.1727 | 0.0010 | |
| GSE77861 | PID1 | 55022 | 237867_s_at | -0.1004 | 0.4071 | |
| GSE97050 | PID1 | 55022 | A_23_P21485 | -0.8328 | 0.1811 | |
| SRP007169 | PID1 | 55022 | RNAseq | 0.7363 | 0.3833 | |
| SRP064894 | PID1 | 55022 | RNAseq | -1.2313 | 0.0009 | |
| SRP133303 | PID1 | 55022 | RNAseq | -1.3554 | 0.0000 | |
| SRP159526 | PID1 | 55022 | RNAseq | -0.6270 | 0.1312 | |
| SRP193095 | PID1 | 55022 | RNAseq | 0.4088 | 0.1583 | |
| SRP219564 | PID1 | 55022 | RNAseq | -0.5010 | 0.4629 | |
| TCGA | PID1 | 55022 | RNAseq | -0.8515 | 0.0000 |
Upregulated datasets: 0; Downregulated datasets: 7.
Survival by PID1 expression:
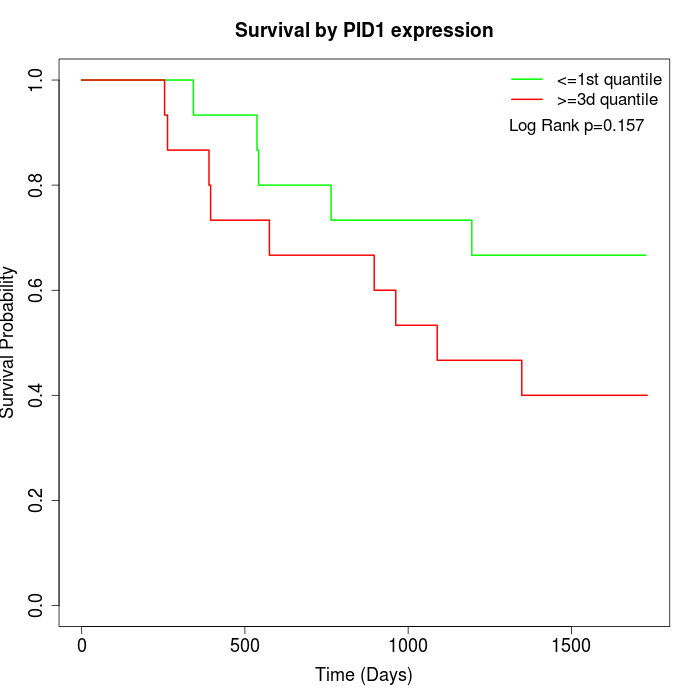 | 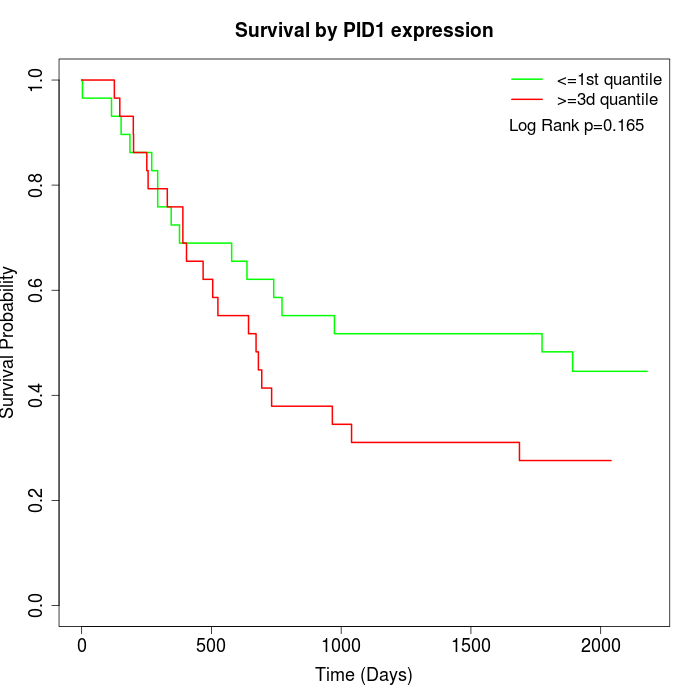 | 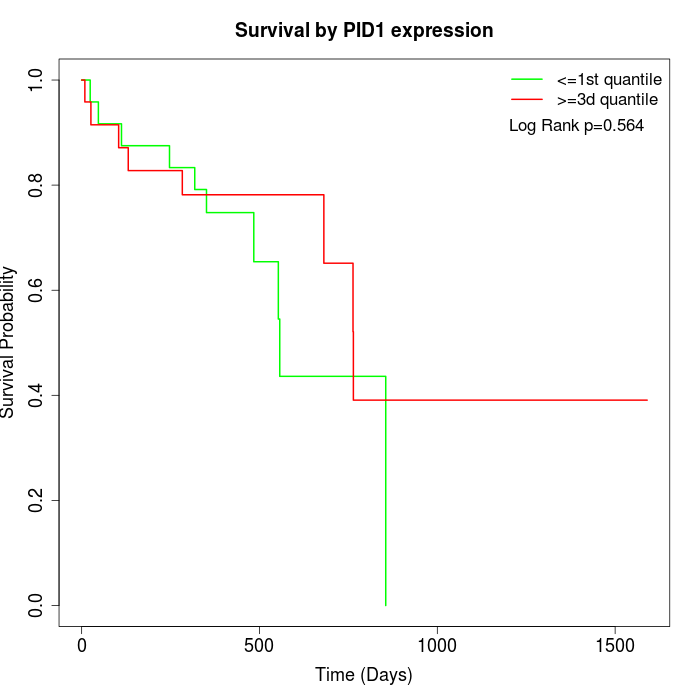 |
| GSE53622 | GSE53624 | TCGA |
Note: Click image to view full size file.
Copy number change of PID1:
| Dataset | Gene | EntrezID | Gain | Loss | Normal | Detail |
|---|---|---|---|---|---|---|
| GSE15526 | PID1 | 55022 | 2 | 12 | 16 | |
| GSE20123 | PID1 | 55022 | 2 | 12 | 16 | |
| GSE43470 | PID1 | 55022 | 2 | 8 | 33 | |
| GSE46452 | PID1 | 55022 | 0 | 5 | 54 | |
| GSE47630 | PID1 | 55022 | 4 | 5 | 31 | |
| GSE54993 | PID1 | 55022 | 1 | 2 | 67 | |
| GSE54994 | PID1 | 55022 | 6 | 11 | 36 | |
| GSE60625 | PID1 | 55022 | 0 | 3 | 8 | |
| GSE74703 | PID1 | 55022 | 2 | 7 | 27 | |
| GSE74704 | PID1 | 55022 | 2 | 6 | 12 | |
| TCGA | PID1 | 55022 | 14 | 28 | 54 |
Total number of gains: 35; Total number of losses: 99; Total Number of normals: 354.
Somatic mutations of PID1:
Generating mutation plots.
Highly correlated genes for PID1:
Showing top 20/1028 corelated genes with mean PCC>0.5.
| Gene1 | Gene2 | Mean PCC | Num. Datasets | Num. PCC<0 | Num. PCC>0.5 |
|---|---|---|---|---|---|
| PID1 | LRRN4CL | 0.789629 | 6 | 0 | 6 |
| PID1 | FXYD1 | 0.776931 | 7 | 0 | 7 |
| PID1 | MAGI2-AS3 | 0.775062 | 5 | 0 | 5 |
| PID1 | FIBIN | 0.772766 | 4 | 0 | 4 |
| PID1 | C1QTNF2 | 0.770725 | 5 | 0 | 5 |
| PID1 | SORCS1 | 0.76629 | 4 | 0 | 4 |
| PID1 | RCAN2 | 0.765194 | 10 | 0 | 9 |
| PID1 | SMIM10 | 0.763567 | 5 | 0 | 5 |
| PID1 | CNRIP1 | 0.763457 | 6 | 0 | 6 |
| PID1 | MGARP | 0.760046 | 3 | 0 | 3 |
| PID1 | HSPB2 | 0.75684 | 10 | 0 | 10 |
| PID1 | GALNT15 | 0.75484 | 5 | 0 | 4 |
| PID1 | MRGPRF | 0.753984 | 6 | 0 | 6 |
| PID1 | MFAP4 | 0.753432 | 9 | 0 | 9 |
| PID1 | LINC01279 | 0.749572 | 4 | 0 | 3 |
| PID1 | PLCXD3 | 0.749104 | 5 | 0 | 5 |
| PID1 | CBX7 | 0.746579 | 8 | 0 | 8 |
| PID1 | OGN | 0.746335 | 9 | 0 | 8 |
| PID1 | DIXDC1 | 0.744567 | 11 | 0 | 11 |
| PID1 | ATP1A2 | 0.743429 | 8 | 0 | 8 |
For details and further investigation, click here