| Full name: cannabinoid receptor interacting protein 1 | Alias Symbol: DKFZP566K1924|CRIP1|CRIP1a|CRIP1b | ||
| Type: protein-coding gene | Cytoband: 2p14 | ||
| Entrez ID: 25927 | HGNC ID: HGNC:24546 | Ensembl Gene: ENSG00000119865 | OMIM ID: |
Expression of CNRIP1:
| Dataset | Gene | EntrezID | Probe | Log2FC | Adj.pValue | Expression |
|---|---|---|---|---|---|---|
| GSE17351 | CNRIP1 | 25927 | 226751_at | -0.9250 | 0.2796 | |
| GSE26886 | CNRIP1 | 25927 | 226751_at | 0.2332 | 0.5772 | |
| GSE45670 | CNRIP1 | 25927 | 226751_at | -1.8419 | 0.0001 | |
| GSE53622 | CNRIP1 | 25927 | 94239 | -0.6859 | 0.0000 | |
| GSE53624 | CNRIP1 | 25927 | 94239 | -0.4018 | 0.0080 | |
| GSE63941 | CNRIP1 | 25927 | 226751_at | -5.6713 | 0.0000 | |
| GSE77861 | CNRIP1 | 25927 | 226751_at | 0.3412 | 0.1500 | |
| GSE97050 | CNRIP1 | 25927 | A_23_P329353 | -0.4363 | 0.1646 | |
| SRP007169 | CNRIP1 | 25927 | RNAseq | 1.7974 | 0.0141 | |
| SRP008496 | CNRIP1 | 25927 | RNAseq | 2.2967 | 0.0001 | |
| SRP064894 | CNRIP1 | 25927 | RNAseq | 0.3060 | 0.3752 | |
| SRP133303 | CNRIP1 | 25927 | RNAseq | -0.3707 | 0.2527 | |
| SRP159526 | CNRIP1 | 25927 | RNAseq | -0.4248 | 0.2022 | |
| SRP193095 | CNRIP1 | 25927 | RNAseq | 0.7222 | 0.0098 | |
| SRP219564 | CNRIP1 | 25927 | RNAseq | -0.1829 | 0.8111 | |
| TCGA | CNRIP1 | 25927 | RNAseq | -0.5165 | 0.0002 |
Upregulated datasets: 2; Downregulated datasets: 2.
Survival by CNRIP1 expression:
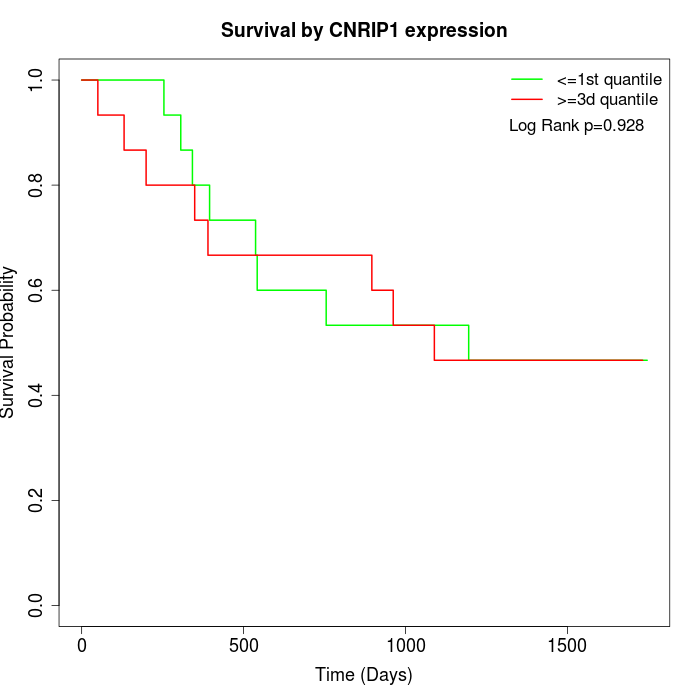 | 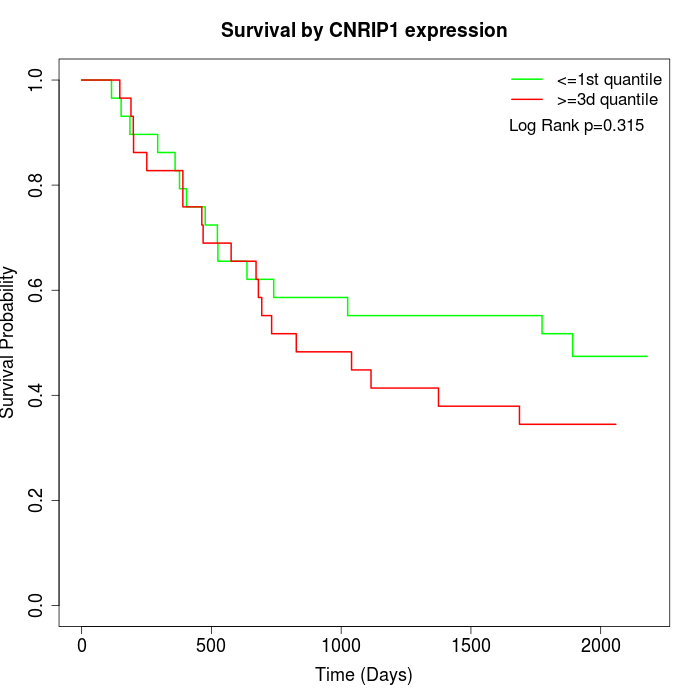 | 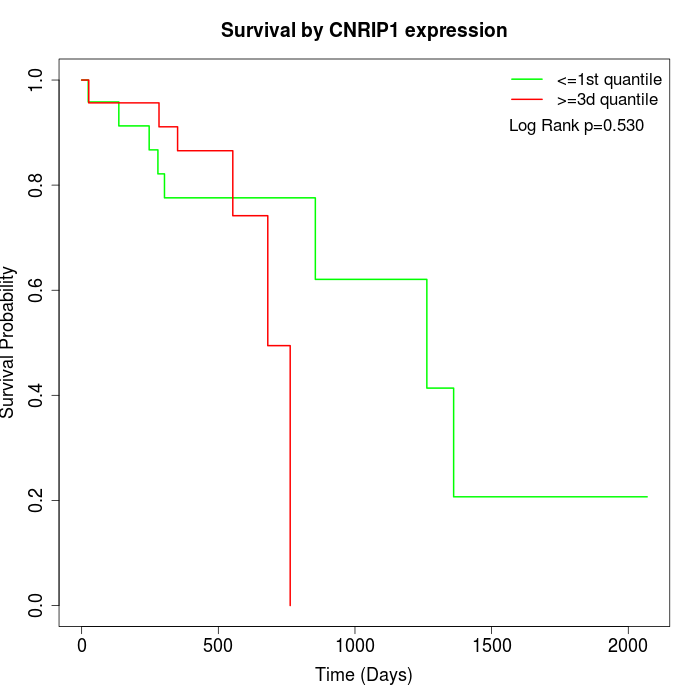 |
| GSE53622 | GSE53624 | TCGA |
Note: Click image to view full size file.
Copy number change of CNRIP1:
| Dataset | Gene | EntrezID | Gain | Loss | Normal | Detail |
|---|---|---|---|---|---|---|
| GSE15526 | CNRIP1 | 25927 | 11 | 0 | 19 | |
| GSE20123 | CNRIP1 | 25927 | 11 | 0 | 19 | |
| GSE43470 | CNRIP1 | 25927 | 6 | 0 | 37 | |
| GSE46452 | CNRIP1 | 25927 | 2 | 3 | 54 | |
| GSE47630 | CNRIP1 | 25927 | 7 | 0 | 33 | |
| GSE54993 | CNRIP1 | 25927 | 0 | 6 | 64 | |
| GSE54994 | CNRIP1 | 25927 | 12 | 0 | 41 | |
| GSE60625 | CNRIP1 | 25927 | 0 | 3 | 8 | |
| GSE74703 | CNRIP1 | 25927 | 6 | 0 | 30 | |
| GSE74704 | CNRIP1 | 25927 | 9 | 0 | 11 | |
| TCGA | CNRIP1 | 25927 | 36 | 2 | 58 |
Total number of gains: 100; Total number of losses: 14; Total Number of normals: 374.
Somatic mutations of CNRIP1:
Generating mutation plots.
Highly correlated genes for CNRIP1:
Showing top 20/1153 corelated genes with mean PCC>0.5.
| Gene1 | Gene2 | Mean PCC | Num. Datasets | Num. PCC<0 | Num. PCC>0.5 |
|---|---|---|---|---|---|
| CNRIP1 | SMPD1 | 0.905205 | 3 | 0 | 3 |
| CNRIP1 | LAMA2 | 0.844803 | 5 | 0 | 5 |
| CNRIP1 | ZNF521 | 0.82808 | 7 | 0 | 7 |
| CNRIP1 | ZEB2 | 0.82676 | 8 | 0 | 8 |
| CNRIP1 | OLFML1 | 0.824567 | 9 | 0 | 9 |
| CNRIP1 | GNG11 | 0.82365 | 9 | 0 | 8 |
| CNRIP1 | DDR2 | 0.822743 | 9 | 0 | 9 |
| CNRIP1 | GNG2 | 0.817446 | 5 | 0 | 5 |
| CNRIP1 | ANK2 | 0.804894 | 5 | 0 | 5 |
| CNRIP1 | MAGI2-AS3 | 0.804147 | 6 | 0 | 6 |
| CNRIP1 | ANXA6 | 0.802625 | 8 | 0 | 8 |
| CNRIP1 | PDE7B | 0.798907 | 6 | 0 | 6 |
| CNRIP1 | DCN | 0.797759 | 9 | 0 | 9 |
| CNRIP1 | ZFAND5 | 0.797205 | 3 | 0 | 3 |
| CNRIP1 | FIBIN | 0.796009 | 6 | 0 | 5 |
| CNRIP1 | TNFSF12 | 0.791707 | 4 | 0 | 4 |
| CNRIP1 | MIER1 | 0.791194 | 3 | 0 | 3 |
| CNRIP1 | OLFML3 | 0.789574 | 9 | 0 | 9 |
| CNRIP1 | ADAMTS5 | 0.788549 | 9 | 0 | 8 |
| CNRIP1 | PMP22 | 0.788083 | 9 | 0 | 8 |
For details and further investigation, click here