| Full name: phospholipase C epsilon 1 | Alias Symbol: KIAA1516|PLCE|NPHS3 | ||
| Type: protein-coding gene | Cytoband: 10q23.33 | ||
| Entrez ID: 51196 | HGNC ID: HGNC:17175 | Ensembl Gene: ENSG00000138193 | OMIM ID: 608414 |
PLCE1 involved pathways:
Expression of PLCE1:
| Dataset | Gene | EntrezID | Probe | Log2FC | Adj.pValue | Expression |
|---|---|---|---|---|---|---|
| GSE17351 | PLCE1 | 51196 | 205112_at | -0.5165 | 0.4280 | |
| GSE20347 | PLCE1 | 51196 | 205112_at | 0.0005 | 0.9977 | |
| GSE23400 | PLCE1 | 51196 | 205112_at | -0.1152 | 0.0165 | |
| GSE26886 | PLCE1 | 51196 | 205111_s_at | 0.4281 | 0.1126 | |
| GSE29001 | PLCE1 | 51196 | 205112_at | -0.1613 | 0.1992 | |
| GSE38129 | PLCE1 | 51196 | 205112_at | -0.4557 | 0.0239 | |
| GSE45670 | PLCE1 | 51196 | 205111_s_at | -0.6309 | 0.0810 | |
| GSE53622 | PLCE1 | 51196 | 31729 | -0.2996 | 0.0706 | |
| GSE53624 | PLCE1 | 51196 | 31729 | -0.0875 | 0.5192 | |
| GSE63941 | PLCE1 | 51196 | 205112_at | 1.2417 | 0.2587 | |
| GSE77861 | PLCE1 | 51196 | 1566739_at | -0.0550 | 0.3827 | |
| GSE97050 | PLCE1 | 51196 | A_33_P3346669 | -0.0085 | 0.9875 | |
| SRP007169 | PLCE1 | 51196 | RNAseq | 2.8400 | 0.0006 | |
| SRP008496 | PLCE1 | 51196 | RNAseq | 2.2289 | 0.0045 | |
| SRP064894 | PLCE1 | 51196 | RNAseq | 0.5152 | 0.0768 | |
| SRP133303 | PLCE1 | 51196 | RNAseq | 0.1261 | 0.6128 | |
| SRP159526 | PLCE1 | 51196 | RNAseq | 0.6634 | 0.0326 | |
| SRP193095 | PLCE1 | 51196 | RNAseq | -0.2252 | 0.4933 | |
| SRP219564 | PLCE1 | 51196 | RNAseq | 0.1479 | 0.8451 | |
| TCGA | PLCE1 | 51196 | RNAseq | -0.9848 | 0.0000 |
Upregulated datasets: 2; Downregulated datasets: 0.
Survival by PLCE1 expression:
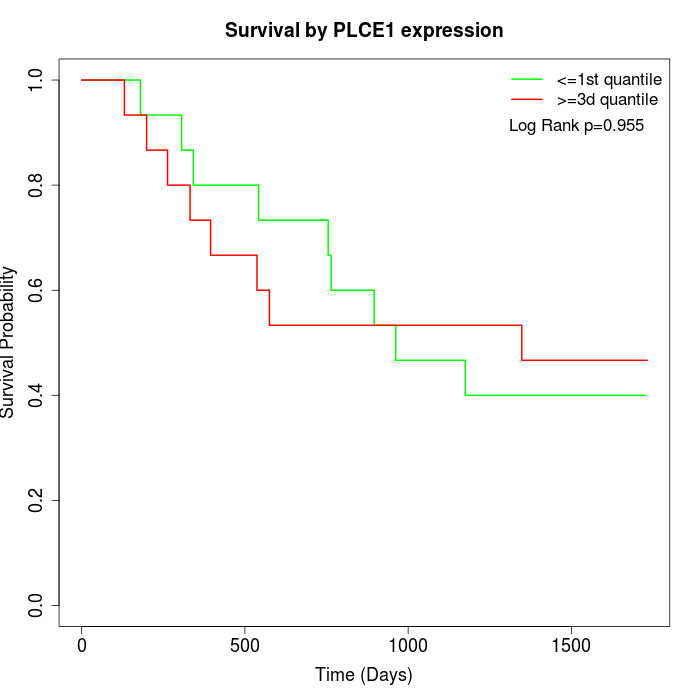 | 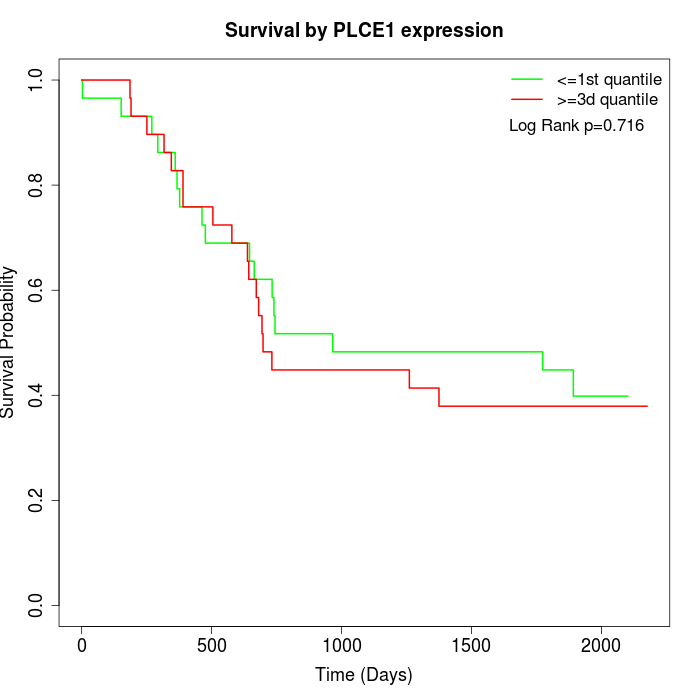 | 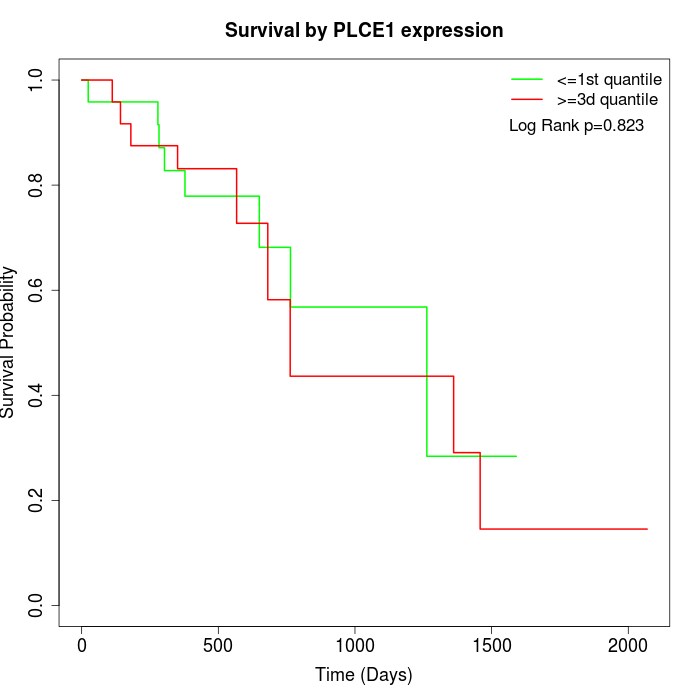 |
| GSE53622 | GSE53624 | TCGA |
Note: Click image to view full size file.
Copy number change of PLCE1:
| Dataset | Gene | EntrezID | Gain | Loss | Normal | Detail |
|---|---|---|---|---|---|---|
| GSE15526 | PLCE1 | 51196 | 1 | 8 | 21 | |
| GSE20123 | PLCE1 | 51196 | 1 | 7 | 22 | |
| GSE43470 | PLCE1 | 51196 | 0 | 7 | 36 | |
| GSE46452 | PLCE1 | 51196 | 0 | 11 | 48 | |
| GSE47630 | PLCE1 | 51196 | 2 | 14 | 24 | |
| GSE54993 | PLCE1 | 51196 | 7 | 0 | 63 | |
| GSE54994 | PLCE1 | 51196 | 1 | 11 | 41 | |
| GSE60625 | PLCE1 | 51196 | 0 | 0 | 11 | |
| GSE74703 | PLCE1 | 51196 | 0 | 5 | 31 | |
| GSE74704 | PLCE1 | 51196 | 0 | 4 | 16 | |
| TCGA | PLCE1 | 51196 | 6 | 26 | 64 |
Total number of gains: 18; Total number of losses: 93; Total Number of normals: 377.
Somatic mutations of PLCE1:
Generating mutation plots.
Highly correlated genes for PLCE1:
Showing top 20/554 corelated genes with mean PCC>0.5.
| Gene1 | Gene2 | Mean PCC | Num. Datasets | Num. PCC<0 | Num. PCC>0.5 |
|---|---|---|---|---|---|
| PLCE1 | SYNC | 0.776829 | 4 | 0 | 4 |
| PLCE1 | CCDC146 | 0.755985 | 3 | 0 | 3 |
| PLCE1 | ZBTB26 | 0.746411 | 3 | 0 | 3 |
| PLCE1 | MECP2 | 0.731779 | 4 | 0 | 4 |
| PLCE1 | KIAA1107 | 0.72419 | 3 | 0 | 3 |
| PLCE1 | FNDC5 | 0.722044 | 4 | 0 | 4 |
| PLCE1 | FRRS1L | 0.708322 | 4 | 0 | 3 |
| PLCE1 | DISC1 | 0.707786 | 3 | 0 | 3 |
| PLCE1 | ZNF548 | 0.703816 | 3 | 0 | 3 |
| PLCE1 | NLGN4X | 0.702171 | 3 | 0 | 3 |
| PLCE1 | ACO1 | 0.697522 | 5 | 0 | 5 |
| PLCE1 | HSPG2 | 0.691819 | 3 | 0 | 3 |
| PLCE1 | PHF11 | 0.691119 | 3 | 0 | 3 |
| PLCE1 | ITGB1BP2 | 0.688601 | 4 | 0 | 3 |
| PLCE1 | ZMAT1 | 0.686287 | 4 | 0 | 3 |
| PLCE1 | ING4 | 0.684511 | 3 | 0 | 3 |
| PLCE1 | PGR | 0.682105 | 6 | 0 | 5 |
| PLCE1 | CAMK2G | 0.682027 | 5 | 0 | 4 |
| PLCE1 | SPOP | 0.68066 | 6 | 0 | 6 |
| PLCE1 | RABL3 | 0.678991 | 4 | 0 | 4 |
For details and further investigation, click here