| Full name: patched 2 | Alias Symbol: | ||
| Type: protein-coding gene | Cytoband: 1p34.1 | ||
| Entrez ID: 8643 | HGNC ID: HGNC:9586 | Ensembl Gene: ENSG00000117425 | OMIM ID: 603673 |
PTCH2 involved pathways:
| KEGG pathway | Description | View |
|---|---|---|
| hsa04340 | Hedgehog signaling pathway | |
| hsa05200 | Pathways in cancer | |
| hsa05217 | Basal cell carcinoma |
Expression of PTCH2:
| Dataset | Gene | EntrezID | Probe | Log2FC | Adj.pValue | Expression |
|---|---|---|---|---|---|---|
| GSE17351 | PTCH2 | 8643 | 221292_at | -0.0702 | 0.7739 | |
| GSE20347 | PTCH2 | 8643 | 221292_at | -0.0020 | 0.9825 | |
| GSE23400 | PTCH2 | 8643 | 221292_at | -0.0746 | 0.0455 | |
| GSE26886 | PTCH2 | 8643 | 221292_at | 0.2216 | 0.0809 | |
| GSE29001 | PTCH2 | 8643 | 221292_at | -0.0648 | 0.6934 | |
| GSE38129 | PTCH2 | 8643 | 221292_at | -0.0544 | 0.4572 | |
| GSE45670 | PTCH2 | 8643 | 221292_at | 0.0328 | 0.6919 | |
| GSE53622 | PTCH2 | 8643 | 13607 | -0.9640 | 0.0000 | |
| GSE53624 | PTCH2 | 8643 | 13607 | -1.5428 | 0.0000 | |
| GSE63941 | PTCH2 | 8643 | 221292_at | 0.3796 | 0.0067 | |
| GSE77861 | PTCH2 | 8643 | 221292_at | 0.0649 | 0.4358 | |
| GSE97050 | PTCH2 | 8643 | A_23_P355311 | -0.3749 | 0.2288 | |
| SRP007169 | PTCH2 | 8643 | RNAseq | 1.9462 | 0.0603 | |
| SRP064894 | PTCH2 | 8643 | RNAseq | 0.6530 | 0.0554 | |
| SRP133303 | PTCH2 | 8643 | RNAseq | -0.8315 | 0.0032 | |
| SRP159526 | PTCH2 | 8643 | RNAseq | 1.6732 | 0.0236 | |
| SRP193095 | PTCH2 | 8643 | RNAseq | 0.3292 | 0.3624 | |
| SRP219564 | PTCH2 | 8643 | RNAseq | 0.3013 | 0.5639 | |
| TCGA | PTCH2 | 8643 | RNAseq | -0.4742 | 0.1258 |
Upregulated datasets: 1; Downregulated datasets: 1.
Survival by PTCH2 expression:
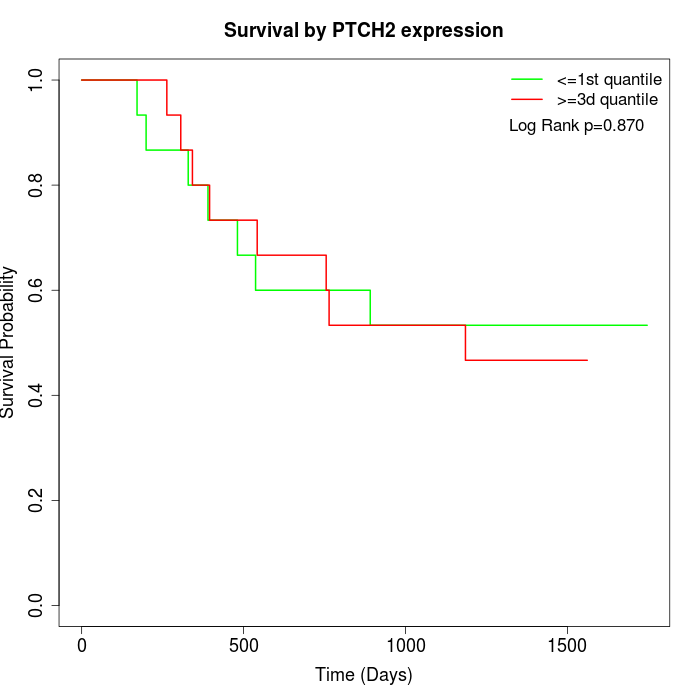 | 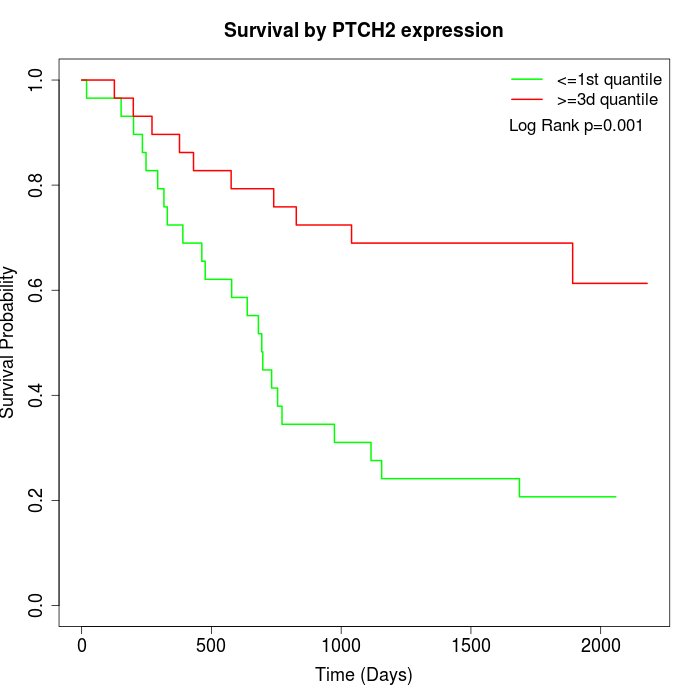 | 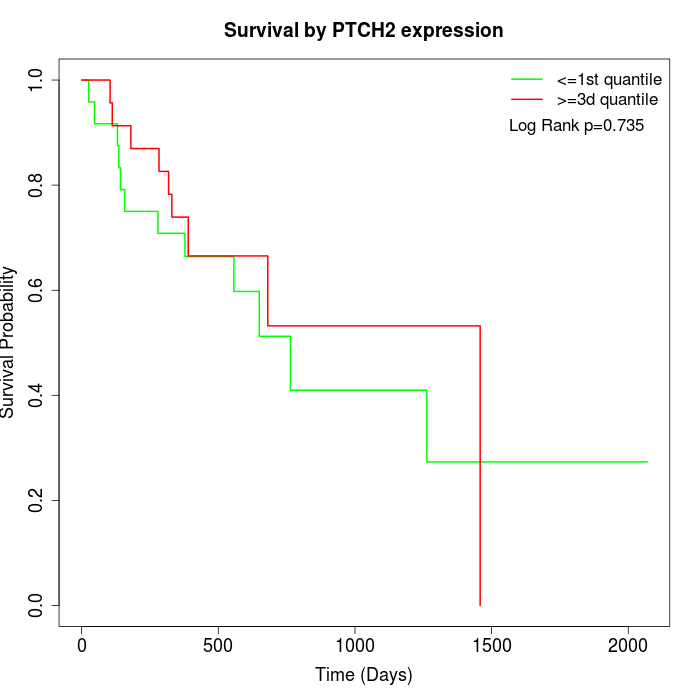 |
| GSE53622 | GSE53624 | TCGA |
Note: Click image to view full size file.
Copy number change of PTCH2:
| Dataset | Gene | EntrezID | Gain | Loss | Normal | Detail |
|---|---|---|---|---|---|---|
| GSE15526 | PTCH2 | 8643 | 4 | 3 | 23 | |
| GSE20123 | PTCH2 | 8643 | 4 | 2 | 24 | |
| GSE43470 | PTCH2 | 8643 | 7 | 2 | 34 | |
| GSE46452 | PTCH2 | 8643 | 2 | 1 | 56 | |
| GSE47630 | PTCH2 | 8643 | 9 | 3 | 28 | |
| GSE54993 | PTCH2 | 8643 | 0 | 1 | 69 | |
| GSE54994 | PTCH2 | 8643 | 13 | 2 | 38 | |
| GSE60625 | PTCH2 | 8643 | 0 | 0 | 11 | |
| GSE74703 | PTCH2 | 8643 | 6 | 1 | 29 | |
| GSE74704 | PTCH2 | 8643 | 2 | 0 | 18 | |
| TCGA | PTCH2 | 8643 | 13 | 16 | 67 |
Total number of gains: 60; Total number of losses: 31; Total Number of normals: 397.
Somatic mutations of PTCH2:
Generating mutation plots.
Highly correlated genes for PTCH2:
Showing top 20/899 corelated genes with mean PCC>0.5.
| Gene1 | Gene2 | Mean PCC | Num. Datasets | Num. PCC<0 | Num. PCC>0.5 |
|---|---|---|---|---|---|
| PTCH2 | KRTAP4-1 | 0.831313 | 3 | 0 | 3 |
| PTCH2 | OR2Z1 | 0.815205 | 3 | 0 | 3 |
| PTCH2 | BARHL2 | 0.803576 | 3 | 0 | 3 |
| PTCH2 | OR10G3 | 0.796368 | 3 | 0 | 3 |
| PTCH2 | FAM163B | 0.795728 | 3 | 0 | 3 |
| PTCH2 | MFSD2B | 0.789742 | 3 | 0 | 3 |
| PTCH2 | KRTAP20-1 | 0.772157 | 3 | 0 | 3 |
| PTCH2 | STAC2 | 0.771469 | 3 | 0 | 3 |
| PTCH2 | IZUMO2 | 0.769326 | 3 | 0 | 3 |
| PTCH2 | DNAI1 | 0.767337 | 4 | 0 | 4 |
| PTCH2 | OR10G8 | 0.760669 | 3 | 0 | 3 |
| PTCH2 | TEN1 | 0.749137 | 3 | 0 | 3 |
| PTCH2 | DCD | 0.744661 | 3 | 0 | 3 |
| PTCH2 | CD164L2 | 0.735454 | 3 | 0 | 3 |
| PTCH2 | KRTAP5-4 | 0.730867 | 3 | 0 | 3 |
| PTCH2 | AXIN1 | 0.725772 | 3 | 0 | 3 |
| PTCH2 | HRC | 0.723933 | 7 | 0 | 7 |
| PTCH2 | KRTAP3-1 | 0.721816 | 3 | 0 | 3 |
| PTCH2 | RNF222 | 0.718792 | 3 | 0 | 3 |
| PTCH2 | RRP1 | 0.716527 | 4 | 0 | 4 |
For details and further investigation, click here