| Full name: SH3 and cysteine rich domain 2 | Alias Symbol: 24b2 | ||
| Type: protein-coding gene | Cytoband: 17q12 | ||
| Entrez ID: 342667 | HGNC ID: HGNC:23990 | Ensembl Gene: ENSG00000141750 | OMIM ID: |
Expression of STAC2:
| Dataset | Gene | EntrezID | Probe | Log2FC | Adj.pValue | Expression |
|---|---|---|---|---|---|---|
| GSE17351 | STAC2 | 342667 | 228888_at | -0.0886 | 0.7625 | |
| GSE26886 | STAC2 | 342667 | 228888_at | 0.0642 | 0.7037 | |
| GSE45670 | STAC2 | 342667 | 228888_at | 0.0785 | 0.4318 | |
| GSE53622 | STAC2 | 342667 | 25834 | 0.0171 | 0.8782 | |
| GSE53624 | STAC2 | 342667 | 25834 | 0.0683 | 0.5232 | |
| GSE63941 | STAC2 | 342667 | 228888_at | 0.3654 | 0.0193 | |
| GSE77861 | STAC2 | 342667 | 228888_at | -0.0600 | 0.5120 | |
| GSE97050 | STAC2 | 342667 | A_32_P152195 | -0.2549 | 0.3302 | |
| SRP133303 | STAC2 | 342667 | RNAseq | -1.0835 | 0.0006 | |
| SRP159526 | STAC2 | 342667 | RNAseq | 1.3238 | 0.2468 | |
| SRP193095 | STAC2 | 342667 | RNAseq | -0.5926 | 0.0050 | |
| SRP219564 | STAC2 | 342667 | RNAseq | -0.5677 | 0.4317 | |
| TCGA | STAC2 | 342667 | RNAseq | 0.1350 | 0.8327 |
Upregulated datasets: 0; Downregulated datasets: 1.
Survival by STAC2 expression:
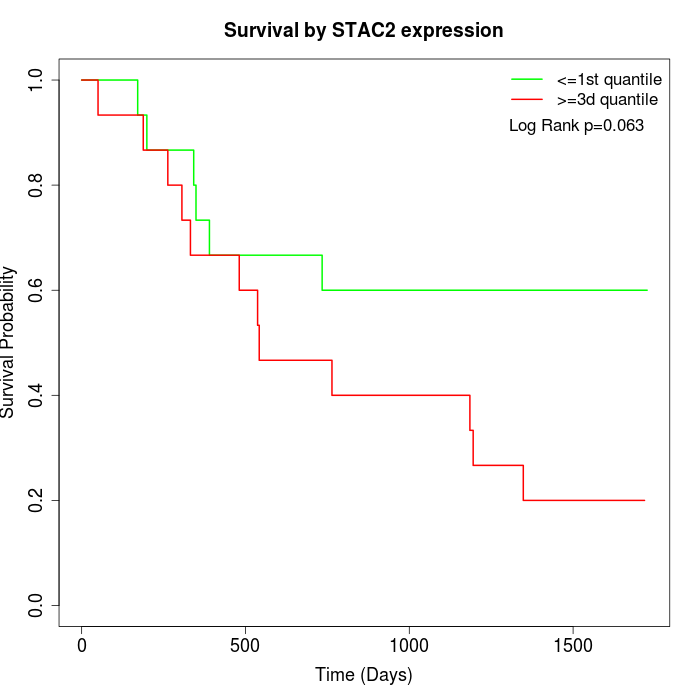 | 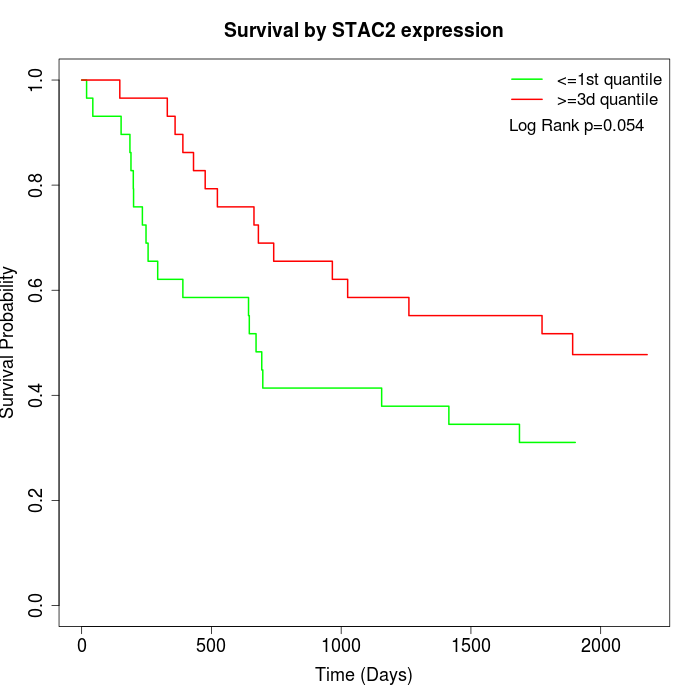 | 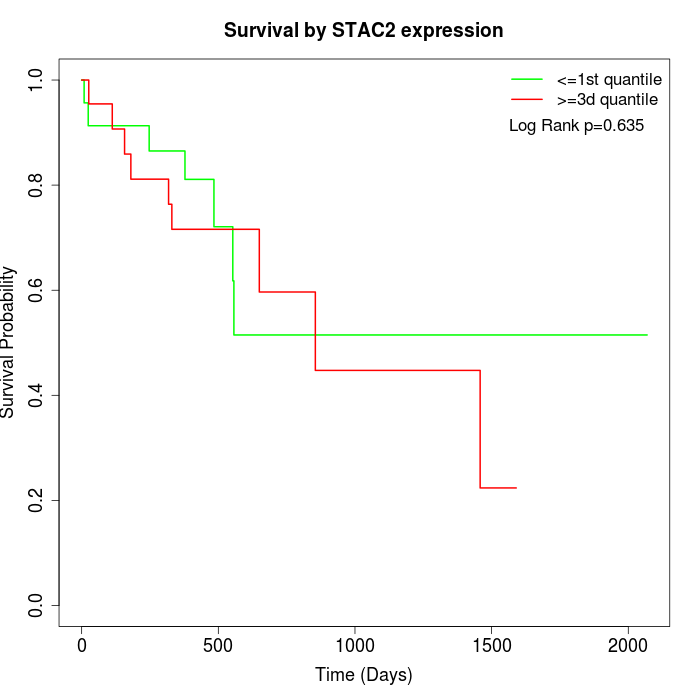 |
| GSE53622 | GSE53624 | TCGA |
Note: Click image to view full size file.
Copy number change of STAC2:
| Dataset | Gene | EntrezID | Gain | Loss | Normal | Detail |
|---|---|---|---|---|---|---|
| GSE15526 | STAC2 | 342667 | 7 | 1 | 22 | |
| GSE20123 | STAC2 | 342667 | 7 | 1 | 22 | |
| GSE43470 | STAC2 | 342667 | 1 | 1 | 41 | |
| GSE46452 | STAC2 | 342667 | 34 | 0 | 25 | |
| GSE47630 | STAC2 | 342667 | 8 | 1 | 31 | |
| GSE54993 | STAC2 | 342667 | 3 | 4 | 63 | |
| GSE54994 | STAC2 | 342667 | 8 | 5 | 40 | |
| GSE60625 | STAC2 | 342667 | 4 | 0 | 7 | |
| GSE74703 | STAC2 | 342667 | 1 | 0 | 35 | |
| GSE74704 | STAC2 | 342667 | 4 | 1 | 15 | |
| TCGA | STAC2 | 342667 | 20 | 8 | 68 |
Total number of gains: 97; Total number of losses: 22; Total Number of normals: 369.
Somatic mutations of STAC2:
Generating mutation plots.
Highly correlated genes for STAC2:
Showing top 20/407 corelated genes with mean PCC>0.5.
| Gene1 | Gene2 | Mean PCC | Num. Datasets | Num. PCC<0 | Num. PCC>0.5 |
|---|---|---|---|---|---|
| STAC2 | PTCH2 | 0.771469 | 3 | 0 | 3 |
| STAC2 | ITIH3 | 0.760955 | 3 | 0 | 3 |
| STAC2 | NEUROD6 | 0.75123 | 3 | 0 | 3 |
| STAC2 | CLEC1B | 0.738307 | 3 | 0 | 3 |
| STAC2 | ACTR3B | 0.723933 | 3 | 0 | 3 |
| STAC2 | JAKMIP3 | 0.720121 | 3 | 0 | 3 |
| STAC2 | ATP2B3 | 0.717692 | 3 | 0 | 3 |
| STAC2 | RAB3IL1 | 0.711924 | 3 | 0 | 3 |
| STAC2 | SCN5A | 0.711208 | 4 | 0 | 3 |
| STAC2 | IQCF3 | 0.706908 | 3 | 0 | 3 |
| STAC2 | CACNG4 | 0.704681 | 5 | 0 | 5 |
| STAC2 | C4BPA | 0.700915 | 3 | 0 | 3 |
| STAC2 | CHST10 | 0.696501 | 3 | 0 | 3 |
| STAC2 | PALM3 | 0.693267 | 4 | 0 | 3 |
| STAC2 | MUC2 | 0.690173 | 3 | 0 | 3 |
| STAC2 | OR2H2 | 0.683895 | 4 | 0 | 3 |
| STAC2 | TSPAN11 | 0.682353 | 3 | 0 | 3 |
| STAC2 | MYLPF | 0.681638 | 3 | 0 | 3 |
| STAC2 | LINC00642 | 0.677707 | 3 | 0 | 3 |
| STAC2 | KCNQ1DN | 0.674478 | 4 | 0 | 3 |
For details and further investigation, click here