| Full name: ribosomal protein S10 | Alias Symbol: MGC88819|S10 | ||
| Type: protein-coding gene | Cytoband: 6p21.31 | ||
| Entrez ID: 6204 | HGNC ID: HGNC:10383 | Ensembl Gene: ENSG00000124614 | OMIM ID: 603632 |
Screen Evidence:
| |||
Expression of RPS10:
| Dataset | Gene | EntrezID | Probe | Log2FC | Adj.pValue | Expression |
|---|---|---|---|---|---|---|
| GSE17351 | RPS10 | 6204 | 211542_x_at | 0.1223 | 0.6172 | |
| GSE20347 | RPS10 | 6204 | 200095_x_at | 0.0575 | 0.4888 | |
| GSE23400 | RPS10 | 6204 | 200095_x_at | 0.0492 | 0.3648 | |
| GSE26886 | RPS10 | 6204 | 200095_x_at | 0.4676 | 0.0000 | |
| GSE29001 | RPS10 | 6204 | 200095_x_at | 0.0083 | 0.9595 | |
| GSE38129 | RPS10 | 6204 | 200095_x_at | 0.0955 | 0.0940 | |
| GSE45670 | RPS10 | 6204 | 200095_x_at | -0.0383 | 0.6642 | |
| GSE53622 | RPS10 | 6204 | 36653 | -0.2474 | 0.0002 | |
| GSE53624 | RPS10 | 6204 | 36653 | 0.2363 | 0.0000 | |
| GSE63941 | RPS10 | 6204 | 211542_x_at | 0.0764 | 0.7081 | |
| GSE77861 | RPS10 | 6204 | 211542_x_at | -0.1500 | 0.4895 | |
| GSE97050 | RPS10 | 6204 | A_23_P356484 | -0.2723 | 0.3928 | |
| SRP007169 | RPS10 | 6204 | RNAseq | -1.0263 | 0.0059 | |
| SRP008496 | RPS10 | 6204 | RNAseq | -0.9542 | 0.0000 | |
| SRP064894 | RPS10 | 6204 | RNAseq | -0.0308 | 0.9351 | |
| SRP133303 | RPS10 | 6204 | RNAseq | -0.5505 | 0.0003 | |
| SRP159526 | RPS10 | 6204 | RNAseq | -0.4812 | 0.0235 | |
| SRP193095 | RPS10 | 6204 | RNAseq | -0.9737 | 0.0000 | |
| SRP219564 | RPS10 | 6204 | RNAseq | -0.5654 | 0.0111 | |
| TCGA | RPS10 | 6204 | RNAseq | 0.0310 | 0.5561 |
Upregulated datasets: 0; Downregulated datasets: 1.
Survival by RPS10 expression:
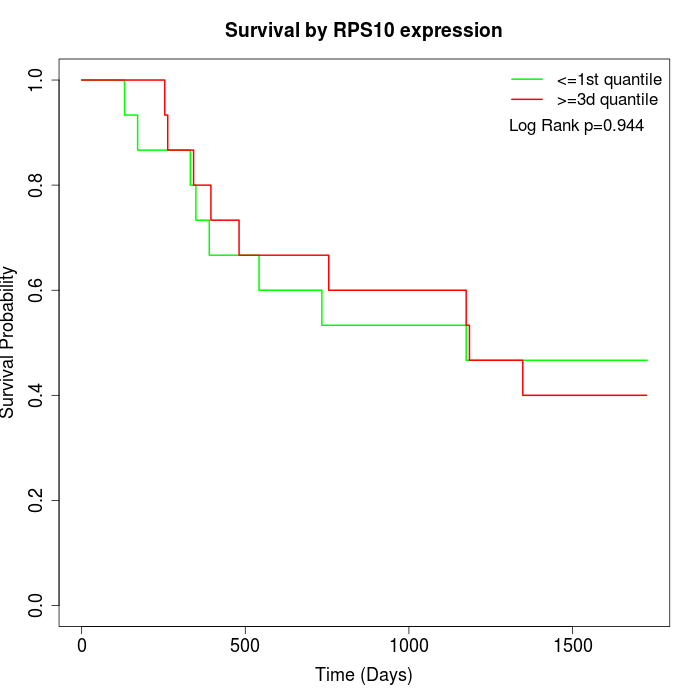 | 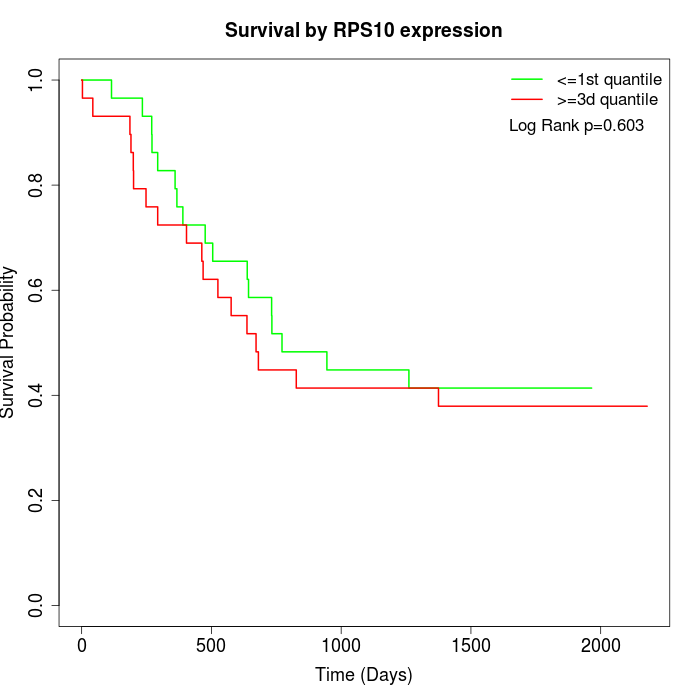 | 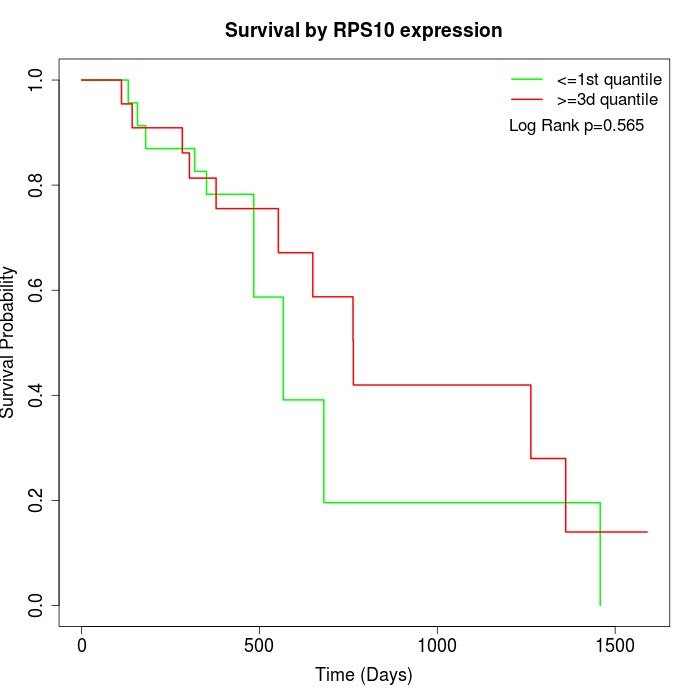 |
| GSE53622 | GSE53624 | TCGA |
Note: Click image to view full size file.
Copy number change of RPS10:
| Dataset | Gene | EntrezID | Gain | Loss | Normal | Detail |
|---|---|---|---|---|---|---|
| GSE15526 | RPS10 | 6204 | 5 | 0 | 25 | |
| GSE20123 | RPS10 | 6204 | 5 | 0 | 25 | |
| GSE43470 | RPS10 | 6204 | 5 | 1 | 37 | |
| GSE46452 | RPS10 | 6204 | 2 | 9 | 48 | |
| GSE47630 | RPS10 | 6204 | 8 | 4 | 28 | |
| GSE54993 | RPS10 | 6204 | 3 | 1 | 66 | |
| GSE54994 | RPS10 | 6204 | 11 | 4 | 38 | |
| GSE60625 | RPS10 | 6204 | 1 | 0 | 10 | |
| GSE74703 | RPS10 | 6204 | 5 | 0 | 31 | |
| GSE74704 | RPS10 | 6204 | 2 | 0 | 18 | |
| TCGA | RPS10 | 6204 | 17 | 15 | 64 |
Total number of gains: 64; Total number of losses: 34; Total Number of normals: 390.
Somatic mutations of RPS10:
Generating mutation plots.
Highly correlated genes for RPS10:
Showing top 20/140 corelated genes with mean PCC>0.5.
| Gene1 | Gene2 | Mean PCC | Num. Datasets | Num. PCC<0 | Num. PCC>0.5 |
|---|---|---|---|---|---|
| RPS10 | TESK1 | 0.686821 | 3 | 0 | 3 |
| RPS10 | TOR3A | 0.669845 | 3 | 0 | 3 |
| RPS10 | COMMD7 | 0.665248 | 3 | 0 | 3 |
| RPS10 | RPS15A | 0.649514 | 9 | 0 | 8 |
| RPS10 | RPS18 | 0.640605 | 11 | 0 | 8 |
| RPS10 | DGUOK | 0.626769 | 3 | 0 | 3 |
| RPS10 | RPL41 | 0.62526 | 5 | 0 | 5 |
| RPS10 | RPL35A | 0.622532 | 9 | 0 | 8 |
| RPS10 | RPL23A | 0.621026 | 10 | 0 | 7 |
| RPS10 | MAF1 | 0.618401 | 3 | 0 | 3 |
| RPS10 | NAP1L1 | 0.61712 | 7 | 0 | 5 |
| RPS10 | RPL27 | 0.612764 | 9 | 0 | 7 |
| RPS10 | CXorf40A | 0.605333 | 3 | 0 | 3 |
| RPS10 | SIMC1 | 0.601246 | 3 | 0 | 3 |
| RPS10 | ATG101 | 0.594224 | 3 | 0 | 3 |
| RPS10 | URI1 | 0.592188 | 4 | 0 | 3 |
| RPS10 | DAZAP2 | 0.586002 | 5 | 0 | 4 |
| RPS10 | SUPT3H | 0.585565 | 5 | 0 | 4 |
| RPS10 | RRP36 | 0.582589 | 4 | 0 | 3 |
| RPS10 | RPA3 | 0.581939 | 5 | 0 | 3 |
For details and further investigation, click here