| Full name: peptidoglycan recognition protein 1 | Alias Symbol: TAG7|PGRP|PGRP-S|PGRPS | ||
| Type: protein-coding gene | Cytoband: 19q13.32 | ||
| Entrez ID: 8993 | HGNC ID: HGNC:8904 | Ensembl Gene: ENSG00000008438 | OMIM ID: 604963 |
Screen Evidence:
| |||
Expression of PGLYRP1:
| Dataset | Gene | EntrezID | Probe | Log2FC | Adj.pValue | Expression |
|---|---|---|---|---|---|---|
| GSE17351 | PGLYRP1 | 8993 | 207384_at | -0.2236 | 0.4247 | |
| GSE20347 | PGLYRP1 | 8993 | 207384_at | -0.2025 | 0.0254 | |
| GSE23400 | PGLYRP1 | 8993 | 207384_at | -0.1596 | 0.0000 | |
| GSE26886 | PGLYRP1 | 8993 | 207384_at | 0.0151 | 0.9260 | |
| GSE29001 | PGLYRP1 | 8993 | 207384_at | 0.0042 | 0.9795 | |
| GSE38129 | PGLYRP1 | 8993 | 207384_at | -0.2287 | 0.0003 | |
| GSE45670 | PGLYRP1 | 8993 | 207384_at | -0.0118 | 0.9314 | |
| GSE53622 | PGLYRP1 | 8993 | 93750 | 0.2007 | 0.0081 | |
| GSE53624 | PGLYRP1 | 8993 | 93750 | 0.1468 | 0.0222 | |
| GSE63941 | PGLYRP1 | 8993 | 207384_at | 0.0523 | 0.8121 | |
| GSE77861 | PGLYRP1 | 8993 | 207384_at | -0.1263 | 0.4096 | |
| GSE97050 | PGLYRP1 | 8993 | A_23_P208747 | 0.0313 | 0.9332 | |
| TCGA | PGLYRP1 | 8993 | RNAseq | -0.9601 | 0.1096 |
Upregulated datasets: 0; Downregulated datasets: 0.
Survival by PGLYRP1 expression:
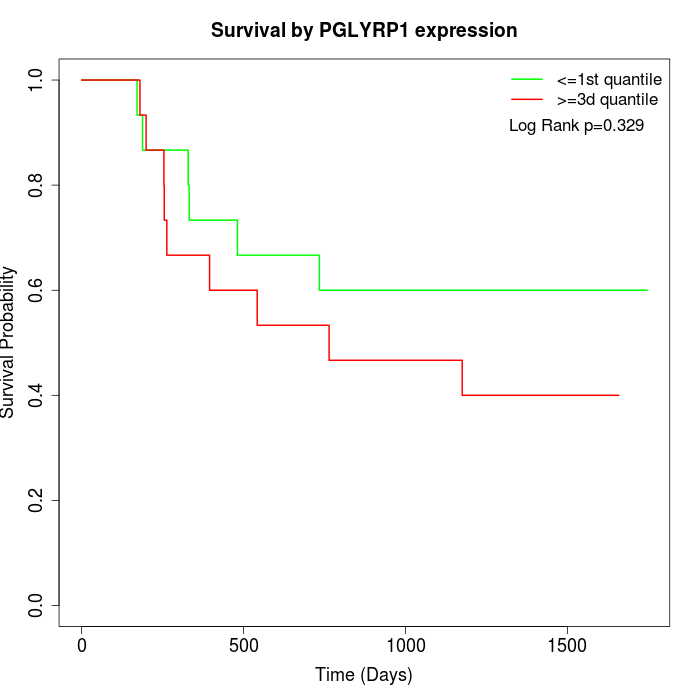 | 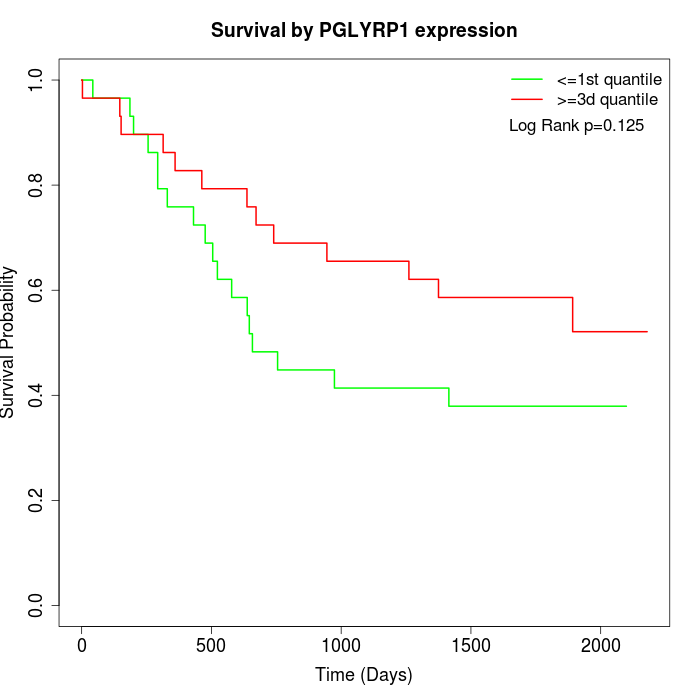 | 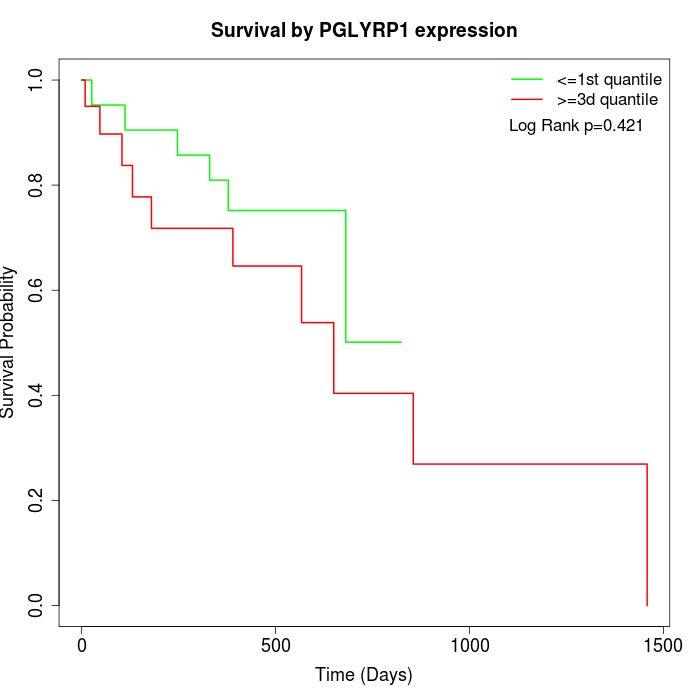 |
| GSE53622 | GSE53624 | TCGA |
Note: Click image to view full size file.
Copy number change of PGLYRP1:
| Dataset | Gene | EntrezID | Gain | Loss | Normal | Detail |
|---|---|---|---|---|---|---|
| GSE15526 | PGLYRP1 | 8993 | 4 | 5 | 21 | |
| GSE20123 | PGLYRP1 | 8993 | 4 | 4 | 22 | |
| GSE43470 | PGLYRP1 | 8993 | 3 | 11 | 29 | |
| GSE46452 | PGLYRP1 | 8993 | 45 | 1 | 13 | |
| GSE47630 | PGLYRP1 | 8993 | 8 | 7 | 25 | |
| GSE54993 | PGLYRP1 | 8993 | 17 | 4 | 49 | |
| GSE54994 | PGLYRP1 | 8993 | 5 | 13 | 35 | |
| GSE60625 | PGLYRP1 | 8993 | 9 | 0 | 2 | |
| GSE74703 | PGLYRP1 | 8993 | 3 | 7 | 26 | |
| GSE74704 | PGLYRP1 | 8993 | 4 | 2 | 14 | |
| TCGA | PGLYRP1 | 8993 | 16 | 15 | 65 |
Total number of gains: 118; Total number of losses: 69; Total Number of normals: 301.
Somatic mutations of PGLYRP1:
Generating mutation plots.
Highly correlated genes for PGLYRP1:
Showing top 20/700 corelated genes with mean PCC>0.5.
| Gene1 | Gene2 | Mean PCC | Num. Datasets | Num. PCC<0 | Num. PCC>0.5 |
|---|---|---|---|---|---|
| PGLYRP1 | RGL4 | 0.821139 | 3 | 0 | 3 |
| PGLYRP1 | SPNS3 | 0.806144 | 3 | 0 | 3 |
| PGLYRP1 | SCN1B | 0.787831 | 3 | 0 | 3 |
| PGLYRP1 | SEC14L4 | 0.758546 | 3 | 0 | 3 |
| PGLYRP1 | SCN3A | 0.742471 | 3 | 0 | 3 |
| PGLYRP1 | KIF26A | 0.736155 | 3 | 0 | 3 |
| PGLYRP1 | ABCC6 | 0.721066 | 4 | 0 | 4 |
| PGLYRP1 | SHANK1 | 0.717382 | 5 | 0 | 5 |
| PGLYRP1 | PROCA1 | 0.71493 | 3 | 0 | 3 |
| PGLYRP1 | BEST3 | 0.71094 | 3 | 0 | 3 |
| PGLYRP1 | MATN1 | 0.704786 | 4 | 0 | 3 |
| PGLYRP1 | ACAD10 | 0.702512 | 3 | 0 | 3 |
| PGLYRP1 | MECR | 0.698769 | 3 | 0 | 3 |
| PGLYRP1 | CTSE | 0.696613 | 5 | 0 | 5 |
| PGLYRP1 | IGSF9B | 0.694553 | 4 | 0 | 3 |
| PGLYRP1 | PGLYRP2 | 0.694111 | 4 | 0 | 3 |
| PGLYRP1 | FUT7 | 0.693431 | 4 | 0 | 4 |
| PGLYRP1 | EVX1 | 0.693229 | 5 | 0 | 4 |
| PGLYRP1 | COX4I2 | 0.690515 | 3 | 0 | 3 |
| PGLYRP1 | ABCA2 | 0.685428 | 4 | 0 | 4 |
For details and further investigation, click here