| Full name: stromal antigen 1 | Alias Symbol: SA-1|SCC3A|SA1 | ||
| Type: protein-coding gene | Cytoband: 3q22.3 | ||
| Entrez ID: 10274 | HGNC ID: HGNC:11354 | Ensembl Gene: ENSG00000118007 | OMIM ID: 604358 |
Screen Evidence:
| |||
STAG1 involved pathways:
| KEGG pathway | Description | View |
|---|---|---|
| hsa04110 | Cell cycle |
Expression of STAG1:
| Dataset | Gene | EntrezID | Probe | Log2FC | Adj.pValue | Expression |
|---|---|---|---|---|---|---|
| GSE17351 | STAG1 | 10274 | 202293_at | 0.2986 | 0.3055 | |
| GSE20347 | STAG1 | 10274 | 202294_at | 0.1701 | 0.2861 | |
| GSE23400 | STAG1 | 10274 | 202294_at | 0.2315 | 0.0035 | |
| GSE26886 | STAG1 | 10274 | 202294_at | 0.5050 | 0.0273 | |
| GSE29001 | STAG1 | 10274 | 202294_at | 0.3543 | 0.2440 | |
| GSE38129 | STAG1 | 10274 | 202294_at | 0.0446 | 0.7724 | |
| GSE45670 | STAG1 | 10274 | 202294_at | -0.1998 | 0.2496 | |
| GSE53622 | STAG1 | 10274 | 114115 | 0.3188 | 0.0000 | |
| GSE53624 | STAG1 | 10274 | 114115 | 0.4540 | 0.0015 | |
| GSE63941 | STAG1 | 10274 | 202293_at | -0.4815 | 0.3731 | |
| GSE77861 | STAG1 | 10274 | 202294_at | 0.0541 | 0.8769 | |
| GSE97050 | STAG1 | 10274 | A_23_P357365 | 0.2469 | 0.3948 | |
| SRP007169 | STAG1 | 10274 | RNAseq | 0.2186 | 0.5821 | |
| SRP008496 | STAG1 | 10274 | RNAseq | 0.5793 | 0.0233 | |
| SRP064894 | STAG1 | 10274 | RNAseq | 0.2936 | 0.1180 | |
| SRP133303 | STAG1 | 10274 | RNAseq | 0.3872 | 0.0052 | |
| SRP159526 | STAG1 | 10274 | RNAseq | 0.2519 | 0.4852 | |
| SRP193095 | STAG1 | 10274 | RNAseq | 0.3461 | 0.0007 | |
| SRP219564 | STAG1 | 10274 | RNAseq | 0.1665 | 0.3047 | |
| TCGA | STAG1 | 10274 | RNAseq | 0.0768 | 0.1901 |
Upregulated datasets: 0; Downregulated datasets: 0.
Survival by STAG1 expression:
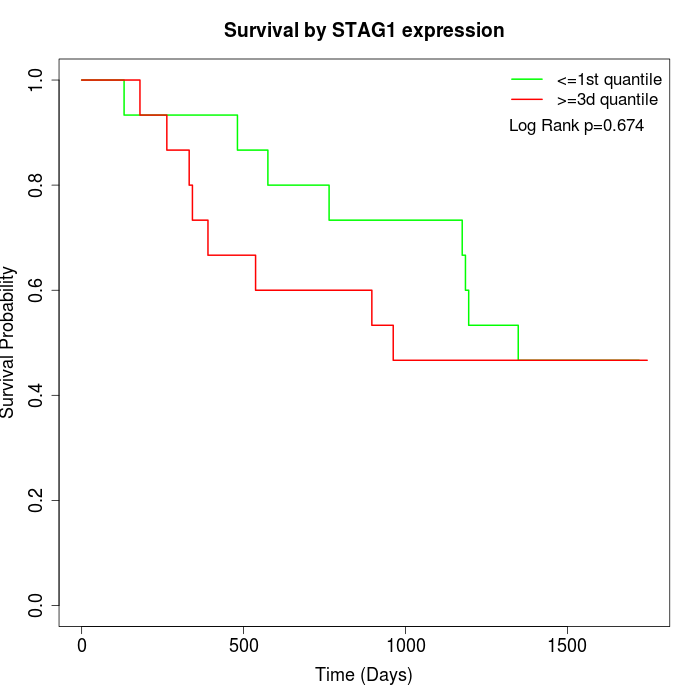 | 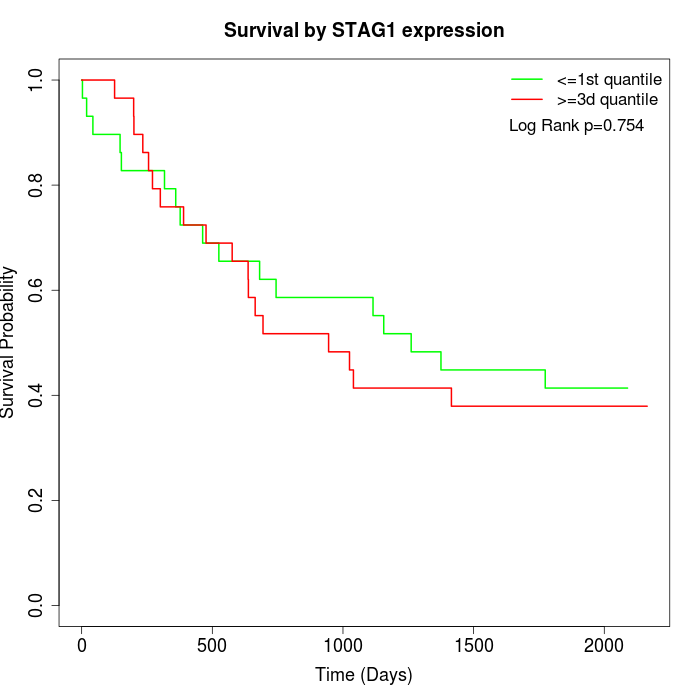 | 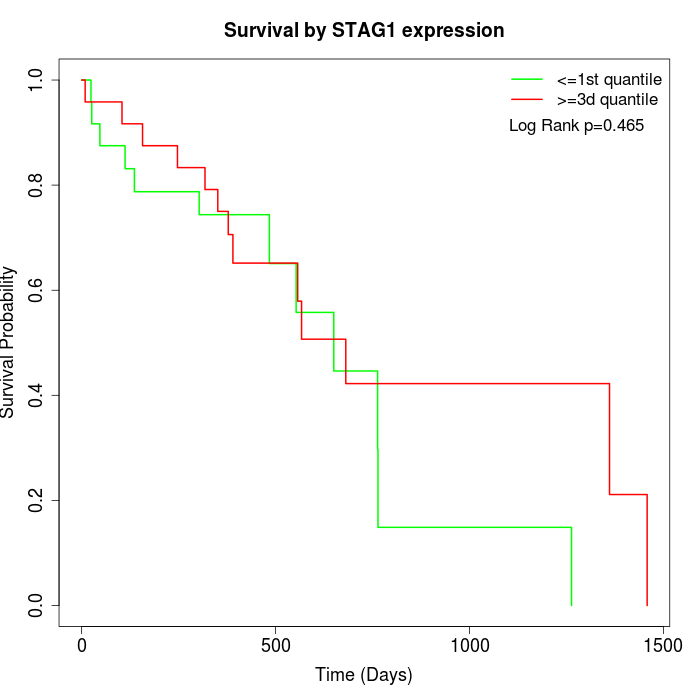 |
| GSE53622 | GSE53624 | TCGA |
Note: Click image to view full size file.
Copy number change of STAG1:
| Dataset | Gene | EntrezID | Gain | Loss | Normal | Detail |
|---|---|---|---|---|---|---|
| GSE15526 | STAG1 | 10274 | 16 | 0 | 14 | |
| GSE20123 | STAG1 | 10274 | 16 | 0 | 14 | |
| GSE43470 | STAG1 | 10274 | 22 | 0 | 21 | |
| GSE46452 | STAG1 | 10274 | 15 | 4 | 40 | |
| GSE47630 | STAG1 | 10274 | 18 | 3 | 19 | |
| GSE54993 | STAG1 | 10274 | 2 | 8 | 60 | |
| GSE54994 | STAG1 | 10274 | 32 | 1 | 20 | |
| GSE60625 | STAG1 | 10274 | 0 | 6 | 5 | |
| GSE74703 | STAG1 | 10274 | 19 | 0 | 17 | |
| GSE74704 | STAG1 | 10274 | 11 | 0 | 9 | |
| TCGA | STAG1 | 10274 | 59 | 5 | 32 |
Total number of gains: 210; Total number of losses: 27; Total Number of normals: 251.
Somatic mutations of STAG1:
Generating mutation plots.
Highly correlated genes for STAG1:
Showing top 20/717 corelated genes with mean PCC>0.5.
| Gene1 | Gene2 | Mean PCC | Num. Datasets | Num. PCC<0 | Num. PCC>0.5 |
|---|---|---|---|---|---|
| STAG1 | RRP1B | 0.815626 | 3 | 0 | 3 |
| STAG1 | CENPBD1 | 0.804069 | 3 | 0 | 3 |
| STAG1 | ZDHHC6 | 0.780984 | 3 | 0 | 3 |
| STAG1 | PTBP1 | 0.776813 | 3 | 0 | 3 |
| STAG1 | AP1AR | 0.767503 | 4 | 0 | 4 |
| STAG1 | C12orf73 | 0.759431 | 3 | 0 | 3 |
| STAG1 | ELF4 | 0.750505 | 3 | 0 | 3 |
| STAG1 | PSMD3 | 0.749122 | 3 | 0 | 3 |
| STAG1 | ZSCAN29 | 0.746679 | 3 | 0 | 3 |
| STAG1 | CCNJ | 0.735957 | 4 | 0 | 3 |
| STAG1 | SPATA2 | 0.732092 | 4 | 0 | 3 |
| STAG1 | UHRF1BP1 | 0.730929 | 4 | 0 | 4 |
| STAG1 | SNW1 | 0.729868 | 3 | 0 | 3 |
| STAG1 | ZBTB39 | 0.725629 | 3 | 0 | 3 |
| STAG1 | GLIS3 | 0.724151 | 3 | 0 | 3 |
| STAG1 | TEX10 | 0.721553 | 3 | 0 | 3 |
| STAG1 | TDRD5 | 0.719821 | 3 | 0 | 3 |
| STAG1 | JKAMP | 0.719729 | 4 | 0 | 4 |
| STAG1 | ZCCHC3 | 0.717463 | 3 | 0 | 3 |
| STAG1 | PIGM | 0.715787 | 4 | 0 | 3 |
For details and further investigation, click here