| Full name: polypyrimidine tract binding protein 1 | Alias Symbol: HNRPI|HNRNP-I|PTB2|PTB3|PTB-1|PTB4|pPTB | ||
| Type: protein-coding gene | Cytoband: 19p13.3 | ||
| Entrez ID: 5725 | HGNC ID: HGNC:9583 | Ensembl Gene: ENSG00000011304 | OMIM ID: 600693 |
Screen Evidence:
| |||
Expression of PTBP1:
| Dataset | Gene | EntrezID | Probe | Log2FC | Adj.pValue | Expression |
|---|---|---|---|---|---|---|
| GSE17351 | PTBP1 | 5725 | 211270_x_at | 0.5324 | 0.0895 | |
| GSE20347 | PTBP1 | 5725 | 211270_x_at | 0.2295 | 0.0534 | |
| GSE23400 | PTBP1 | 5725 | 211270_x_at | 0.4384 | 0.0000 | |
| GSE26886 | PTBP1 | 5725 | 211270_x_at | 0.3011 | 0.0124 | |
| GSE29001 | PTBP1 | 5725 | 211270_x_at | 0.2835 | 0.0409 | |
| GSE38129 | PTBP1 | 5725 | 211270_x_at | 0.5196 | 0.0000 | |
| GSE45670 | PTBP1 | 5725 | 211270_x_at | 0.3109 | 0.0005 | |
| GSE53622 | PTBP1 | 5725 | 49475 | 0.3988 | 0.0000 | |
| GSE53624 | PTBP1 | 5725 | 49475 | 0.8113 | 0.0000 | |
| GSE63941 | PTBP1 | 5725 | 211270_x_at | 0.5466 | 0.0011 | |
| GSE77861 | PTBP1 | 5725 | 211270_x_at | 0.3637 | 0.0632 | |
| GSE97050 | PTBP1 | 5725 | A_24_P14367 | 0.5631 | 0.1657 | |
| SRP007169 | PTBP1 | 5725 | RNAseq | 0.1134 | 0.6954 | |
| SRP008496 | PTBP1 | 5725 | RNAseq | -0.0097 | 0.9558 | |
| SRP064894 | PTBP1 | 5725 | RNAseq | 0.3201 | 0.0163 | |
| SRP133303 | PTBP1 | 5725 | RNAseq | 0.4174 | 0.0068 | |
| SRP159526 | PTBP1 | 5725 | RNAseq | 0.2987 | 0.1048 | |
| SRP193095 | PTBP1 | 5725 | RNAseq | 0.2450 | 0.0023 | |
| SRP219564 | PTBP1 | 5725 | RNAseq | 0.4667 | 0.1534 | |
| TCGA | PTBP1 | 5725 | RNAseq | 0.1640 | 0.0000 |
Upregulated datasets: 0; Downregulated datasets: 0.
Survival by PTBP1 expression:
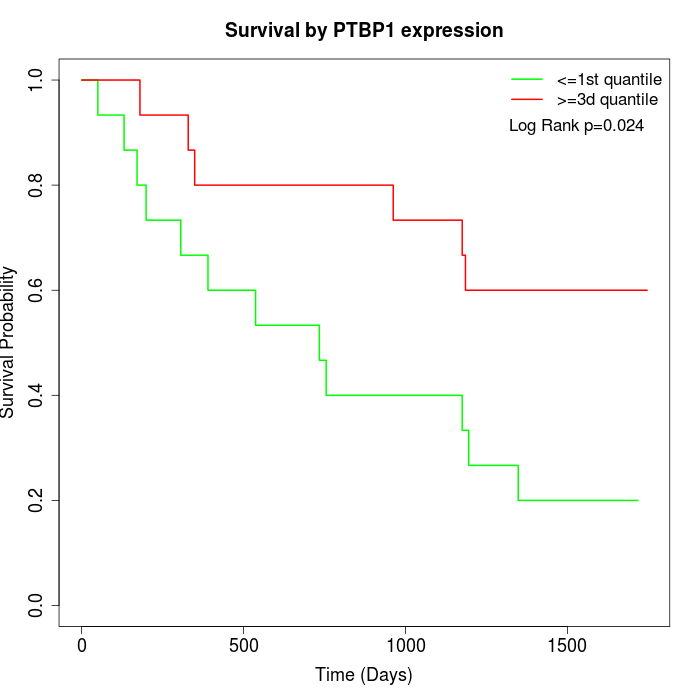 | 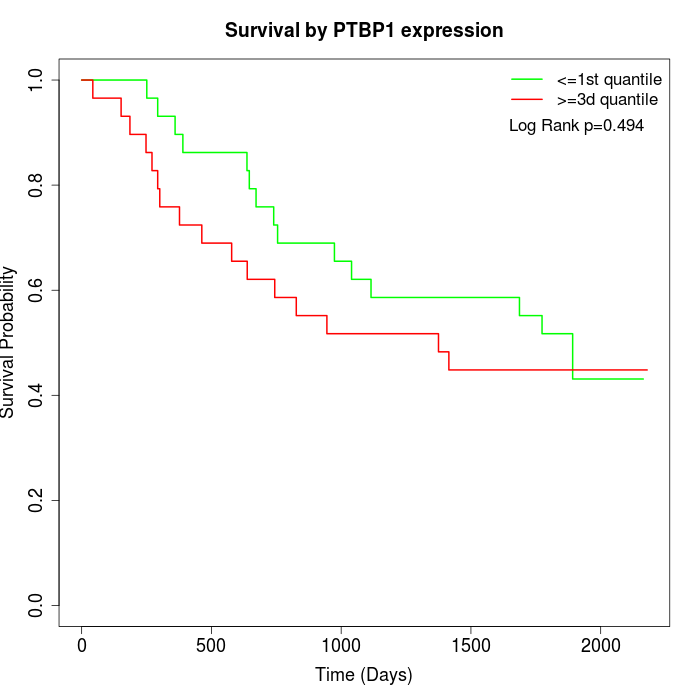 | 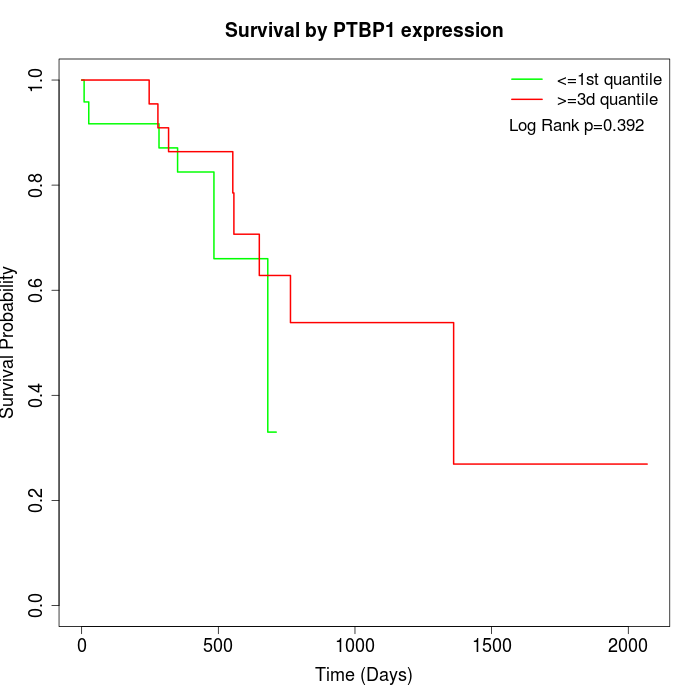 |
| GSE53622 | GSE53624 | TCGA |
Note: Click image to view full size file.
Copy number change of PTBP1:
| Dataset | Gene | EntrezID | Gain | Loss | Normal | Detail |
|---|---|---|---|---|---|---|
| GSE15526 | PTBP1 | 5725 | 4 | 6 | 20 | |
| GSE20123 | PTBP1 | 5725 | 4 | 5 | 21 | |
| GSE43470 | PTBP1 | 5725 | 1 | 10 | 32 | |
| GSE46452 | PTBP1 | 5725 | 47 | 1 | 11 | |
| GSE47630 | PTBP1 | 5725 | 5 | 7 | 28 | |
| GSE54993 | PTBP1 | 5725 | 13 | 4 | 53 | |
| GSE54994 | PTBP1 | 5725 | 8 | 15 | 30 | |
| GSE60625 | PTBP1 | 5725 | 9 | 0 | 2 | |
| GSE74703 | PTBP1 | 5725 | 1 | 7 | 28 | |
| GSE74704 | PTBP1 | 5725 | 3 | 3 | 14 | |
| TCGA | PTBP1 | 5725 | 8 | 25 | 63 |
Total number of gains: 103; Total number of losses: 83; Total Number of normals: 302.
Somatic mutations of PTBP1:
Generating mutation plots.
Highly correlated genes for PTBP1:
Showing top 20/1862 corelated genes with mean PCC>0.5.
| Gene1 | Gene2 | Mean PCC | Num. Datasets | Num. PCC<0 | Num. PCC>0.5 |
|---|---|---|---|---|---|
| PTBP1 | EBNA1BP2 | 0.793388 | 3 | 0 | 3 |
| PTBP1 | CSTF2T | 0.778023 | 3 | 0 | 3 |
| PTBP1 | STAG1 | 0.776813 | 3 | 0 | 3 |
| PTBP1 | ETV6 | 0.769721 | 3 | 0 | 3 |
| PTBP1 | TMEM63B | 0.768776 | 4 | 0 | 4 |
| PTBP1 | UCK2 | 0.767801 | 3 | 0 | 3 |
| PTBP1 | CDC25A | 0.764367 | 11 | 0 | 11 |
| PTBP1 | XXYLT1 | 0.761014 | 5 | 0 | 5 |
| PTBP1 | PPHLN1 | 0.75929 | 4 | 0 | 4 |
| PTBP1 | DDX39A | 0.757511 | 10 | 0 | 10 |
| PTBP1 | DKC1 | 0.75743 | 3 | 0 | 3 |
| PTBP1 | ZNF707 | 0.755937 | 3 | 0 | 3 |
| PTBP1 | PPP1R9B | 0.753613 | 4 | 0 | 4 |
| PTBP1 | DOCK6 | 0.751933 | 4 | 0 | 4 |
| PTBP1 | EFTUD2 | 0.750371 | 8 | 0 | 8 |
| PTBP1 | TMTC4 | 0.749177 | 3 | 0 | 3 |
| PTBP1 | LMNB2 | 0.744523 | 11 | 0 | 10 |
| PTBP1 | SRSF2 | 0.743093 | 3 | 0 | 3 |
| PTBP1 | TIMELESS | 0.743081 | 12 | 0 | 11 |
| PTBP1 | RAB1B | 0.736947 | 3 | 0 | 3 |
For details and further investigation, click here