| Full name: adaptor related protein complex 1 associated regulatory protein | Alias Symbol: PRO0971|2C18|gamma-BAR | ||
| Type: protein-coding gene | Cytoband: 4q25 | ||
| Entrez ID: 55435 | HGNC ID: HGNC:28808 | Ensembl Gene: ENSG00000138660 | OMIM ID: 610851 |
Expression of AP1AR:
| Dataset | Gene | EntrezID | Probe | Log2FC | Adj.pValue | Expression |
|---|---|---|---|---|---|---|
| GSE17351 | AP1AR | 55435 | 219023_at | 0.3748 | 0.3568 | |
| GSE20347 | AP1AR | 55435 | 219023_at | -0.3591 | 0.0189 | |
| GSE23400 | AP1AR | 55435 | 219023_at | 0.0914 | 0.1080 | |
| GSE26886 | AP1AR | 55435 | 219023_at | -1.7137 | 0.0002 | |
| GSE29001 | AP1AR | 55435 | 219023_at | 0.1011 | 0.8686 | |
| GSE38129 | AP1AR | 55435 | 219023_at | -0.0435 | 0.8363 | |
| GSE45670 | AP1AR | 55435 | 219023_at | -0.1979 | 0.2409 | |
| GSE53622 | AP1AR | 55435 | 84336 | -0.0947 | 0.3737 | |
| GSE53624 | AP1AR | 55435 | 84336 | -0.1757 | 0.1301 | |
| GSE63941 | AP1AR | 55435 | 219023_at | -0.5082 | 0.3159 | |
| GSE77861 | AP1AR | 55435 | 219023_at | 0.0651 | 0.8564 | |
| GSE97050 | AP1AR | 55435 | A_23_P69791 | 0.3049 | 0.2151 | |
| SRP007169 | AP1AR | 55435 | RNAseq | -0.4523 | 0.2726 | |
| SRP008496 | AP1AR | 55435 | RNAseq | -0.3738 | 0.0955 | |
| SRP064894 | AP1AR | 55435 | RNAseq | -0.3521 | 0.2224 | |
| SRP133303 | AP1AR | 55435 | RNAseq | 0.3531 | 0.0977 | |
| SRP159526 | AP1AR | 55435 | RNAseq | -0.5294 | 0.0043 | |
| SRP193095 | AP1AR | 55435 | RNAseq | -0.4139 | 0.0005 | |
| SRP219564 | AP1AR | 55435 | RNAseq | -0.3836 | 0.2480 | |
| TCGA | AP1AR | 55435 | RNAseq | 0.0877 | 0.1027 |
Upregulated datasets: 0; Downregulated datasets: 1.
Survival by AP1AR expression:
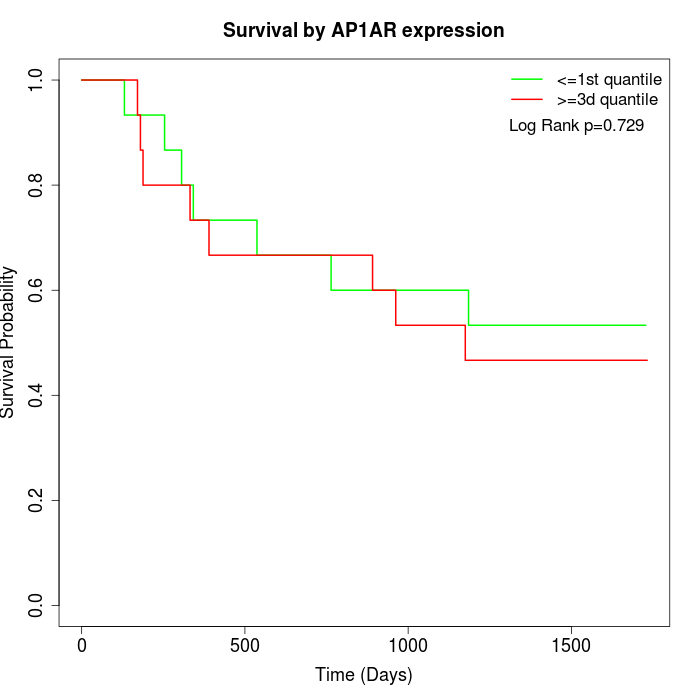 | 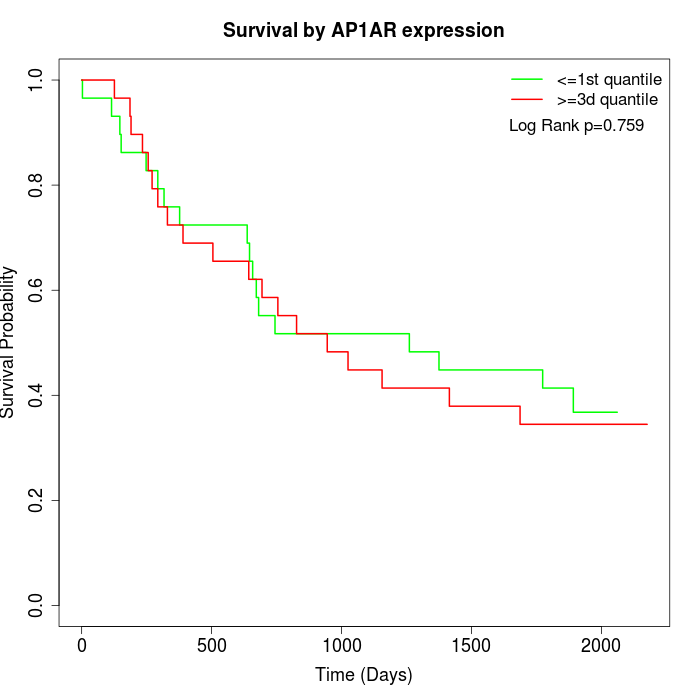 | 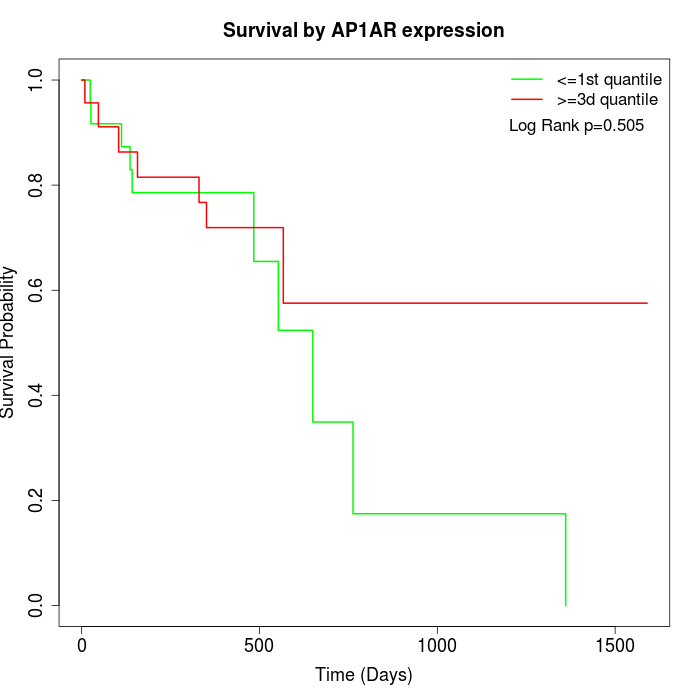 |
| GSE53622 | GSE53624 | TCGA |
Note: Click image to view full size file.
Copy number change of AP1AR:
| Dataset | Gene | EntrezID | Gain | Loss | Normal | Detail |
|---|---|---|---|---|---|---|
| GSE15526 | AP1AR | 55435 | 1 | 13 | 16 | |
| GSE20123 | AP1AR | 55435 | 1 | 13 | 16 | |
| GSE43470 | AP1AR | 55435 | 0 | 14 | 29 | |
| GSE46452 | AP1AR | 55435 | 1 | 36 | 22 | |
| GSE47630 | AP1AR | 55435 | 0 | 20 | 20 | |
| GSE54993 | AP1AR | 55435 | 9 | 0 | 61 | |
| GSE54994 | AP1AR | 55435 | 1 | 10 | 42 | |
| GSE60625 | AP1AR | 55435 | 0 | 3 | 8 | |
| GSE74703 | AP1AR | 55435 | 0 | 12 | 24 | |
| GSE74704 | AP1AR | 55435 | 0 | 7 | 13 | |
| TCGA | AP1AR | 55435 | 8 | 35 | 53 |
Total number of gains: 21; Total number of losses: 163; Total Number of normals: 304.
Somatic mutations of AP1AR:
Generating mutation plots.
Highly correlated genes for AP1AR:
Showing top 20/420 corelated genes with mean PCC>0.5.
| Gene1 | Gene2 | Mean PCC | Num. Datasets | Num. PCC<0 | Num. PCC>0.5 |
|---|---|---|---|---|---|
| AP1AR | RPAP3 | 0.851133 | 3 | 0 | 3 |
| AP1AR | XRCC6 | 0.826601 | 3 | 0 | 3 |
| AP1AR | PSMB7 | 0.808096 | 3 | 0 | 3 |
| AP1AR | TFIP11 | 0.802538 | 3 | 0 | 3 |
| AP1AR | TP53RK | 0.771931 | 3 | 0 | 3 |
| AP1AR | STAG1 | 0.767503 | 4 | 0 | 4 |
| AP1AR | MRPL13 | 0.765502 | 3 | 0 | 3 |
| AP1AR | WWP1 | 0.764076 | 3 | 0 | 3 |
| AP1AR | EIF2S2 | 0.763546 | 4 | 0 | 4 |
| AP1AR | CPNE1 | 0.756292 | 3 | 0 | 3 |
| AP1AR | PIGA | 0.744191 | 3 | 0 | 3 |
| AP1AR | RASA2 | 0.738415 | 3 | 0 | 3 |
| AP1AR | PDHX | 0.734575 | 3 | 0 | 3 |
| AP1AR | SMAD1 | 0.732823 | 3 | 0 | 3 |
| AP1AR | ZBTB2 | 0.727586 | 3 | 0 | 3 |
| AP1AR | RAN | 0.725952 | 3 | 0 | 3 |
| AP1AR | RBM12 | 0.725098 | 4 | 0 | 3 |
| AP1AR | THAP11 | 0.721965 | 3 | 0 | 3 |
| AP1AR | ARL13B | 0.721175 | 3 | 0 | 3 |
| AP1AR | LY75 | 0.720865 | 3 | 0 | 3 |
For details and further investigation, click here