| Full name: CENPB DNA-binding domain containing 1 | Alias Symbol: MGC16385 | ||
| Type: protein-coding gene | Cytoband: 16q24.3 | ||
| Entrez ID: 92806 | HGNC ID: HGNC:28272 | Ensembl Gene: ENSG00000177946 | OMIM ID: |
Expression of CENPBD1:
| Dataset | Gene | EntrezID | Probe | Log2FC | Adj.pValue | Expression |
|---|---|---|---|---|---|---|
| GSE17351 | CENPBD1 | 92806 | 223728_at | 0.3731 | 0.0895 | |
| GSE26886 | CENPBD1 | 92806 | 223728_at | 0.6041 | 0.0105 | |
| GSE45670 | CENPBD1 | 92806 | 223728_at | 0.5071 | 0.0000 | |
| GSE63941 | CENPBD1 | 92806 | 223728_at | -0.6399 | 0.0734 | |
| GSE77861 | CENPBD1 | 92806 | 223728_at | 0.0838 | 0.5487 | |
| GSE97050 | CENPBD1 | 92806 | A_23_P206454 | 0.2035 | 0.4199 | |
| SRP007169 | CENPBD1 | 92806 | RNAseq | 0.6767 | 0.3694 | |
| SRP064894 | CENPBD1 | 92806 | RNAseq | 0.4520 | 0.0330 | |
| SRP133303 | CENPBD1 | 92806 | RNAseq | 0.8803 | 0.0000 | |
| SRP159526 | CENPBD1 | 92806 | RNAseq | 0.7221 | 0.0060 | |
| SRP193095 | CENPBD1 | 92806 | RNAseq | 0.3416 | 0.0006 | |
| SRP219564 | CENPBD1 | 92806 | RNAseq | 0.3759 | 0.2807 | |
| TCGA | CENPBD1 | 92806 | RNAseq | 0.0757 | 0.2810 |
Upregulated datasets: 0; Downregulated datasets: 0.
Survival by CENPBD1 expression:
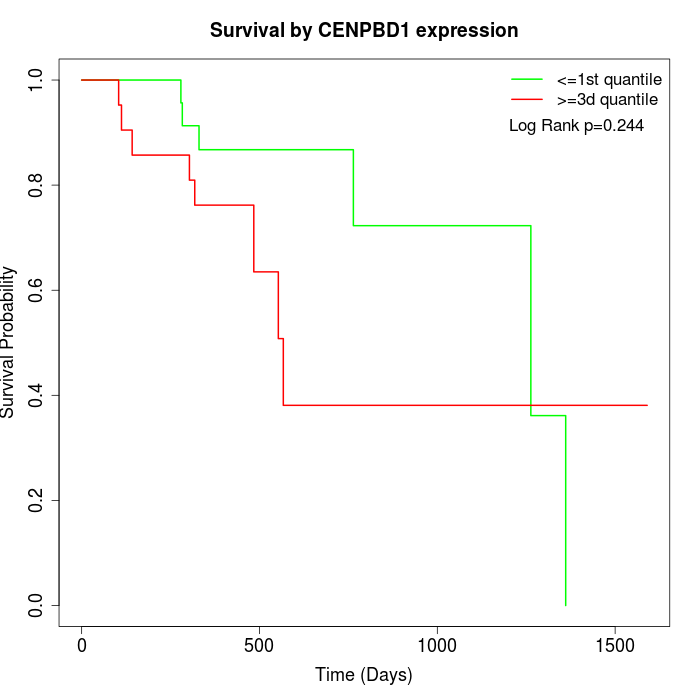 |
| TCGA |
Note: Click image to view full size file.
Copy number change of CENPBD1:
| Dataset | Gene | EntrezID | Gain | Loss | Normal | Detail |
|---|---|---|---|---|---|---|
| GSE15526 | CENPBD1 | 92806 | 4 | 3 | 23 | |
| GSE20123 | CENPBD1 | 92806 | 4 | 3 | 23 | |
| GSE43470 | CENPBD1 | 92806 | 1 | 13 | 29 | |
| GSE46452 | CENPBD1 | 92806 | 38 | 1 | 20 | |
| GSE47630 | CENPBD1 | 92806 | 11 | 9 | 20 | |
| GSE54993 | CENPBD1 | 92806 | 3 | 4 | 63 | |
| GSE54994 | CENPBD1 | 92806 | 9 | 11 | 33 | |
| GSE60625 | CENPBD1 | 92806 | 4 | 0 | 7 | |
| GSE74703 | CENPBD1 | 92806 | 1 | 9 | 26 | |
| GSE74704 | CENPBD1 | 92806 | 3 | 1 | 16 | |
| TCGA | CENPBD1 | 92806 | 26 | 15 | 55 |
Total number of gains: 104; Total number of losses: 69; Total Number of normals: 315.
Somatic mutations of CENPBD1:
Generating mutation plots.
Highly correlated genes for CENPBD1:
Showing top 20/764 corelated genes with mean PCC>0.5.
| Gene1 | Gene2 | Mean PCC | Num. Datasets | Num. PCC<0 | Num. PCC>0.5 |
|---|---|---|---|---|---|
| CENPBD1 | POFUT1 | 0.838945 | 3 | 0 | 3 |
| CENPBD1 | UHRF1BP1 | 0.822301 | 3 | 0 | 3 |
| CENPBD1 | ELK4 | 0.820055 | 3 | 0 | 3 |
| CENPBD1 | TRUB1 | 0.819607 | 3 | 0 | 3 |
| CENPBD1 | CWF19L1 | 0.813172 | 3 | 0 | 3 |
| CENPBD1 | ZNF324B | 0.81094 | 3 | 0 | 3 |
| CENPBD1 | KATNA1 | 0.808035 | 3 | 0 | 3 |
| CENPBD1 | STAG1 | 0.804069 | 3 | 0 | 3 |
| CENPBD1 | DSCC1 | 0.798008 | 3 | 0 | 3 |
| CENPBD1 | CCT6A | 0.795472 | 3 | 0 | 3 |
| CENPBD1 | TDP1 | 0.792943 | 3 | 0 | 3 |
| CENPBD1 | GTF2E2 | 0.79281 | 3 | 0 | 3 |
| CENPBD1 | CDCA3 | 0.791513 | 3 | 0 | 3 |
| CENPBD1 | AGPAT5 | 0.791359 | 3 | 0 | 3 |
| CENPBD1 | INPP5B | 0.78978 | 3 | 0 | 3 |
| CENPBD1 | DTYMK | 0.787535 | 3 | 0 | 3 |
| CENPBD1 | PES1 | 0.786628 | 3 | 0 | 3 |
| CENPBD1 | ERH | 0.783279 | 3 | 0 | 3 |
| CENPBD1 | CENPE | 0.782951 | 3 | 0 | 3 |
| CENPBD1 | ANAPC10 | 0.779718 | 3 | 0 | 3 |
For details and further investigation, click here