| Full name: GLIS family zinc finger 3 | Alias Symbol: MGC33662 | ||
| Type: protein-coding gene | Cytoband: 9p24.2 | ||
| Entrez ID: 169792 | HGNC ID: HGNC:28510 | Ensembl Gene: ENSG00000107249 | OMIM ID: 610192 |
Expression of GLIS3:
| Dataset | Gene | EntrezID | Probe | Log2FC | Adj.pValue | Expression |
|---|---|---|---|---|---|---|
| GSE17351 | GLIS3 | 169792 | 230258_at | 0.6759 | 0.4691 | |
| GSE26886 | GLIS3 | 169792 | 230258_at | 0.8394 | 0.0347 | |
| GSE45670 | GLIS3 | 169792 | 229435_at | 0.3227 | 0.4298 | |
| GSE53622 | GLIS3 | 169792 | 25168 | 1.2228 | 0.0000 | |
| GSE53624 | GLIS3 | 169792 | 25168 | 1.3302 | 0.0000 | |
| GSE63941 | GLIS3 | 169792 | 229435_at | -4.3170 | 0.0005 | |
| GSE77861 | GLIS3 | 169792 | 230258_at | 0.1184 | 0.5119 | |
| GSE97050 | GLIS3 | 169792 | A_23_P384023 | 0.7807 | 0.1057 | |
| SRP007169 | GLIS3 | 169792 | RNAseq | 4.0636 | 0.0000 | |
| SRP008496 | GLIS3 | 169792 | RNAseq | 5.4931 | 0.0000 | |
| SRP064894 | GLIS3 | 169792 | RNAseq | 1.9411 | 0.0000 | |
| SRP133303 | GLIS3 | 169792 | RNAseq | 1.8256 | 0.0000 | |
| SRP159526 | GLIS3 | 169792 | RNAseq | 0.7223 | 0.1017 | |
| SRP219564 | GLIS3 | 169792 | RNAseq | 1.1202 | 0.1068 | |
| TCGA | GLIS3 | 169792 | RNAseq | -0.0237 | 0.8832 |
Upregulated datasets: 6; Downregulated datasets: 1.
Survival by GLIS3 expression:
 | 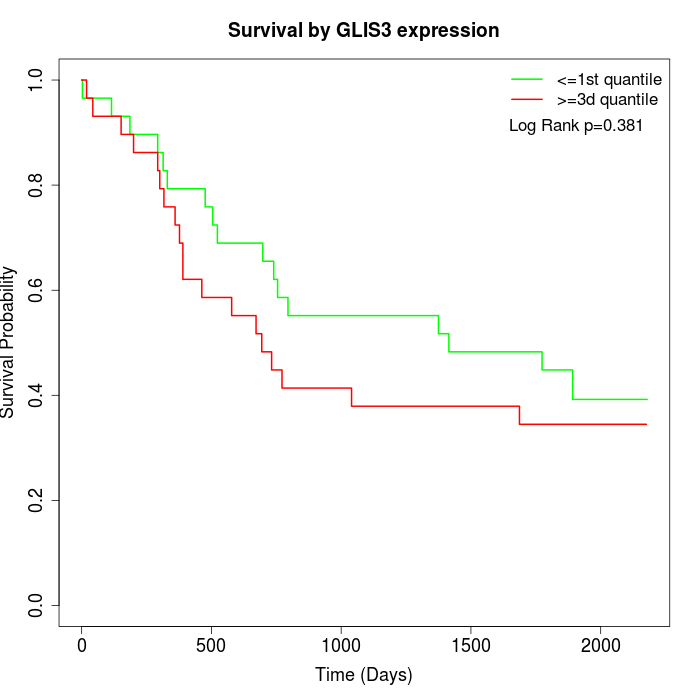 | 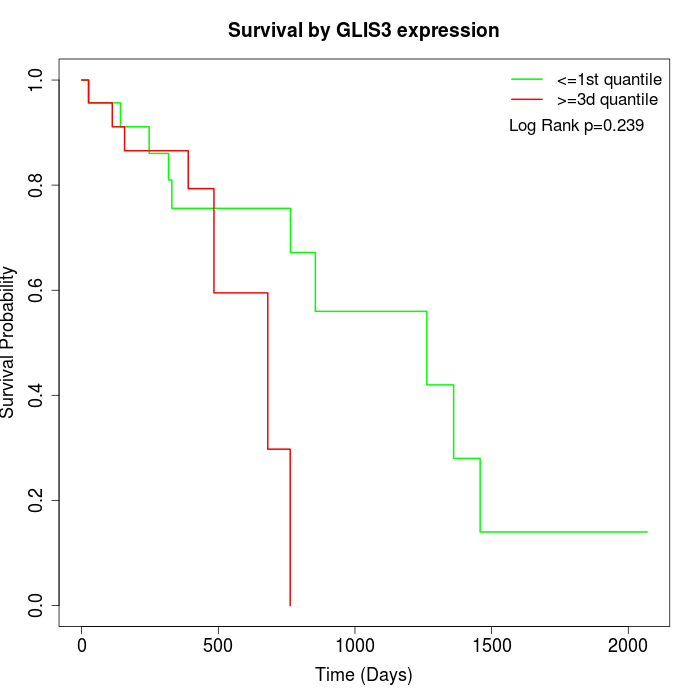 |
| GSE53622 | GSE53624 | TCGA |
Note: Click image to view full size file.
Copy number change of GLIS3:
| Dataset | Gene | EntrezID | Gain | Loss | Normal | Detail |
|---|---|---|---|---|---|---|
| GSE15526 | GLIS3 | 169792 | 1 | 16 | 13 | |
| GSE20123 | GLIS3 | 169792 | 1 | 15 | 14 | |
| GSE43470 | GLIS3 | 169792 | 4 | 13 | 26 | |
| GSE46452 | GLIS3 | 169792 | 2 | 23 | 34 | |
| GSE47630 | GLIS3 | 169792 | 5 | 26 | 9 | |
| GSE54993 | GLIS3 | 169792 | 6 | 3 | 61 | |
| GSE54994 | GLIS3 | 169792 | 9 | 18 | 26 | |
| GSE60625 | GLIS3 | 169792 | 0 | 2 | 9 | |
| GSE74703 | GLIS3 | 169792 | 4 | 10 | 22 | |
| GSE74704 | GLIS3 | 169792 | 0 | 12 | 8 | |
| TCGA | GLIS3 | 169792 | 14 | 50 | 32 |
Total number of gains: 46; Total number of losses: 188; Total Number of normals: 254.
Somatic mutations of GLIS3:
Generating mutation plots.
Highly correlated genes for GLIS3:
Showing top 20/900 corelated genes with mean PCC>0.5.
| Gene1 | Gene2 | Mean PCC | Num. Datasets | Num. PCC<0 | Num. PCC>0.5 |
|---|---|---|---|---|---|
| GLIS3 | MAP4 | 0.835733 | 3 | 0 | 3 |
| GLIS3 | POGLUT1 | 0.804586 | 3 | 0 | 3 |
| GLIS3 | S1PR1 | 0.801394 | 3 | 0 | 3 |
| GLIS3 | CXCL5 | 0.796784 | 3 | 0 | 3 |
| GLIS3 | C11orf24 | 0.768118 | 5 | 0 | 5 |
| GLIS3 | ZNF322 | 0.760869 | 3 | 0 | 3 |
| GLIS3 | NOL4 | 0.759278 | 3 | 0 | 3 |
| GLIS3 | PTGER2 | 0.758094 | 3 | 0 | 3 |
| GLIS3 | DHX40 | 0.757179 | 3 | 0 | 3 |
| GLIS3 | CNRIP1 | 0.753698 | 4 | 0 | 4 |
| GLIS3 | LRRC34 | 0.747231 | 4 | 0 | 4 |
| GLIS3 | MAGI2-AS3 | 0.74523 | 3 | 0 | 3 |
| GLIS3 | MLLT1 | 0.740936 | 3 | 0 | 3 |
| GLIS3 | HS3ST3A1 | 0.740454 | 3 | 0 | 3 |
| GLIS3 | GAS6 | 0.739254 | 3 | 0 | 3 |
| GLIS3 | ZFX | 0.739004 | 3 | 0 | 3 |
| GLIS3 | SWT1 | 0.733508 | 3 | 0 | 3 |
| GLIS3 | RIPPLY3 | 0.730909 | 3 | 0 | 3 |
| GLIS3 | TBC1D19 | 0.730259 | 3 | 0 | 3 |
| GLIS3 | ZNF506 | 0.73024 | 3 | 0 | 3 |
For details and further investigation, click here