| Full name: phosphatidylinositol glycan anchor biosynthesis class M | Alias Symbol: GPI-MT-I | ||
| Type: protein-coding gene | Cytoband: 1q23.2 | ||
| Entrez ID: 93183 | HGNC ID: HGNC:18858 | Ensembl Gene: ENSG00000143315 | OMIM ID: 610273 |
Expression of PIGM:
| Dataset | Gene | EntrezID | Probe | Log2FC | Adj.pValue | Expression |
|---|---|---|---|---|---|---|
| GSE17351 | PIGM | 93183 | 223470_at | 0.0836 | 0.8103 | |
| GSE26886 | PIGM | 93183 | 223470_at | -0.2269 | 0.3154 | |
| GSE45670 | PIGM | 93183 | 223470_at | 0.1319 | 0.3262 | |
| GSE53622 | PIGM | 93183 | 36674 | 0.0313 | 0.7529 | |
| GSE53624 | PIGM | 93183 | 36674 | 0.2424 | 0.0201 | |
| GSE63941 | PIGM | 93183 | 223470_at | -0.1175 | 0.7984 | |
| GSE77861 | PIGM | 93183 | 223470_at | 0.0325 | 0.8975 | |
| GSE97050 | PIGM | 93183 | A_33_P3386965 | 0.1320 | 0.4907 | |
| SRP007169 | PIGM | 93183 | RNAseq | -0.0062 | 0.9880 | |
| SRP008496 | PIGM | 93183 | RNAseq | 0.3711 | 0.2464 | |
| SRP064894 | PIGM | 93183 | RNAseq | -0.0367 | 0.7609 | |
| SRP133303 | PIGM | 93183 | RNAseq | 0.0671 | 0.6717 | |
| SRP159526 | PIGM | 93183 | RNAseq | 0.5643 | 0.0054 | |
| SRP193095 | PIGM | 93183 | RNAseq | 0.0822 | 0.4142 | |
| SRP219564 | PIGM | 93183 | RNAseq | 0.2676 | 0.3961 | |
| TCGA | PIGM | 93183 | RNAseq | -0.0739 | 0.2178 |
Upregulated datasets: 0; Downregulated datasets: 0.
Survival by PIGM expression:
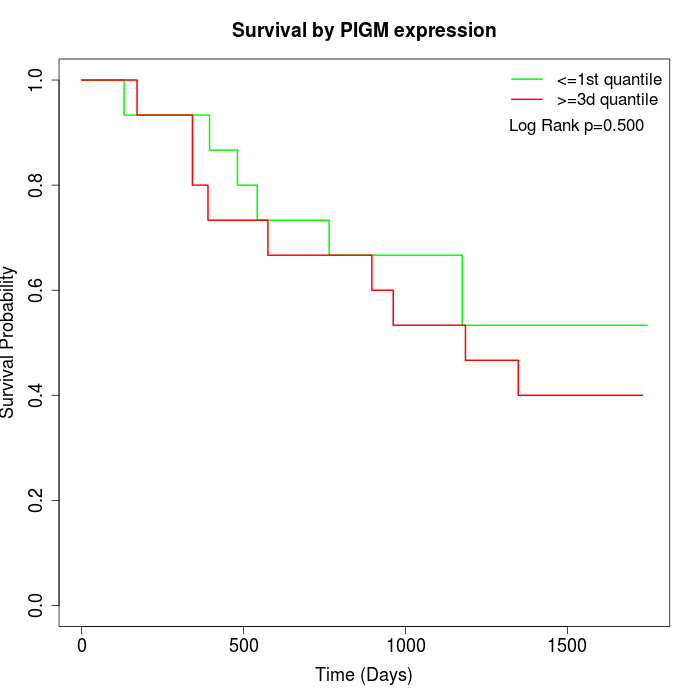 | 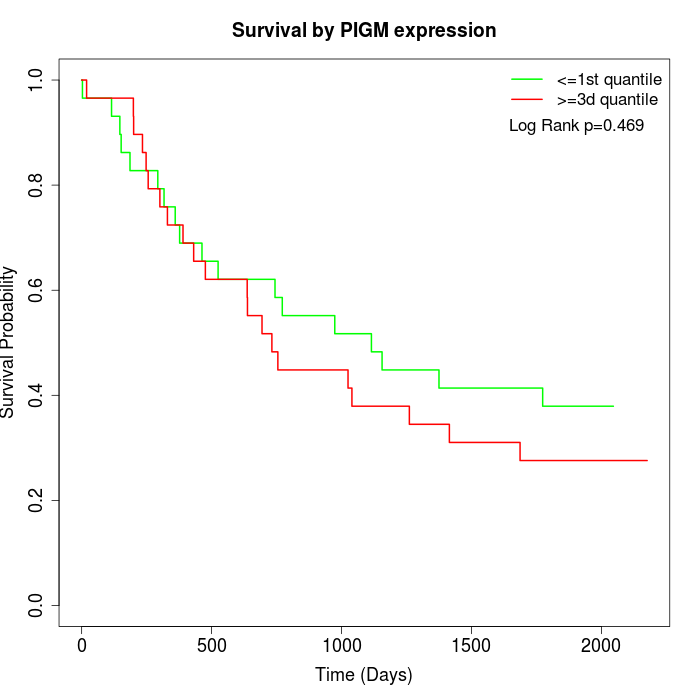 | 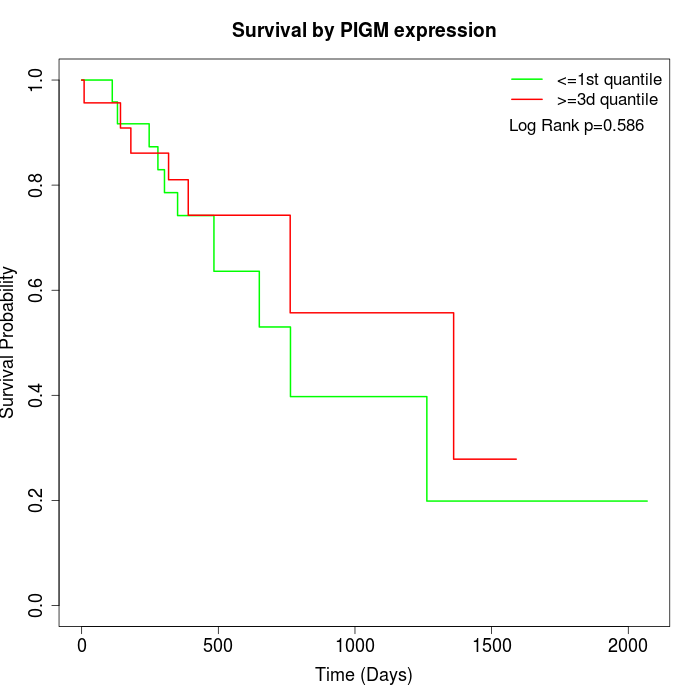 |
| GSE53622 | GSE53624 | TCGA |
Note: Click image to view full size file.
Copy number change of PIGM:
| Dataset | Gene | EntrezID | Gain | Loss | Normal | Detail |
|---|---|---|---|---|---|---|
| GSE15526 | PIGM | 93183 | 10 | 0 | 20 | |
| GSE20123 | PIGM | 93183 | 10 | 0 | 20 | |
| GSE43470 | PIGM | 93183 | 7 | 2 | 34 | |
| GSE46452 | PIGM | 93183 | 2 | 1 | 56 | |
| GSE47630 | PIGM | 93183 | 15 | 0 | 25 | |
| GSE54993 | PIGM | 93183 | 0 | 5 | 65 | |
| GSE54994 | PIGM | 93183 | 16 | 0 | 37 | |
| GSE60625 | PIGM | 93183 | 0 | 0 | 11 | |
| GSE74703 | PIGM | 93183 | 7 | 2 | 27 | |
| GSE74704 | PIGM | 93183 | 4 | 0 | 16 | |
| TCGA | PIGM | 93183 | 44 | 3 | 49 |
Total number of gains: 115; Total number of losses: 13; Total Number of normals: 360.
Somatic mutations of PIGM:
Generating mutation plots.
Highly correlated genes for PIGM:
Showing top 20/215 corelated genes with mean PCC>0.5.
| Gene1 | Gene2 | Mean PCC | Num. Datasets | Num. PCC<0 | Num. PCC>0.5 |
|---|---|---|---|---|---|
| PIGM | COG3 | 0.805237 | 3 | 0 | 3 |
| PIGM | RRP1B | 0.783712 | 3 | 0 | 3 |
| PIGM | LRP11 | 0.77453 | 3 | 0 | 3 |
| PIGM | LATS1 | 0.762171 | 3 | 0 | 3 |
| PIGM | LRRC47 | 0.74484 | 3 | 0 | 3 |
| PIGM | DDX23 | 0.740965 | 3 | 0 | 3 |
| PIGM | TADA2A | 0.739283 | 3 | 0 | 3 |
| PIGM | RNF8 | 0.738082 | 3 | 0 | 3 |
| PIGM | ALG10 | 0.735797 | 3 | 0 | 3 |
| PIGM | ANKRD28 | 0.735463 | 3 | 0 | 3 |
| PIGM | JKAMP | 0.732481 | 3 | 0 | 3 |
| PIGM | TYW1 | 0.729637 | 3 | 0 | 3 |
| PIGM | GDE1 | 0.728346 | 3 | 0 | 3 |
| PIGM | UTP20 | 0.72529 | 3 | 0 | 3 |
| PIGM | LUC7L2 | 0.725172 | 3 | 0 | 3 |
| PIGM | IFT20 | 0.717381 | 3 | 0 | 3 |
| PIGM | STAG1 | 0.715787 | 4 | 0 | 3 |
| PIGM | INTS6 | 0.714961 | 3 | 0 | 3 |
| PIGM | COMMD2 | 0.712762 | 3 | 0 | 3 |
| PIGM | TOMM22 | 0.710057 | 3 | 0 | 3 |
For details and further investigation, click here